Zip Codes with the Highest Percentage of Population Employed in Architecture & Engineering in Oak Park, IL
RELATED REPORTS & OPTIONS
Architecture & Engineering
Oak Park
Compare Zip Codes
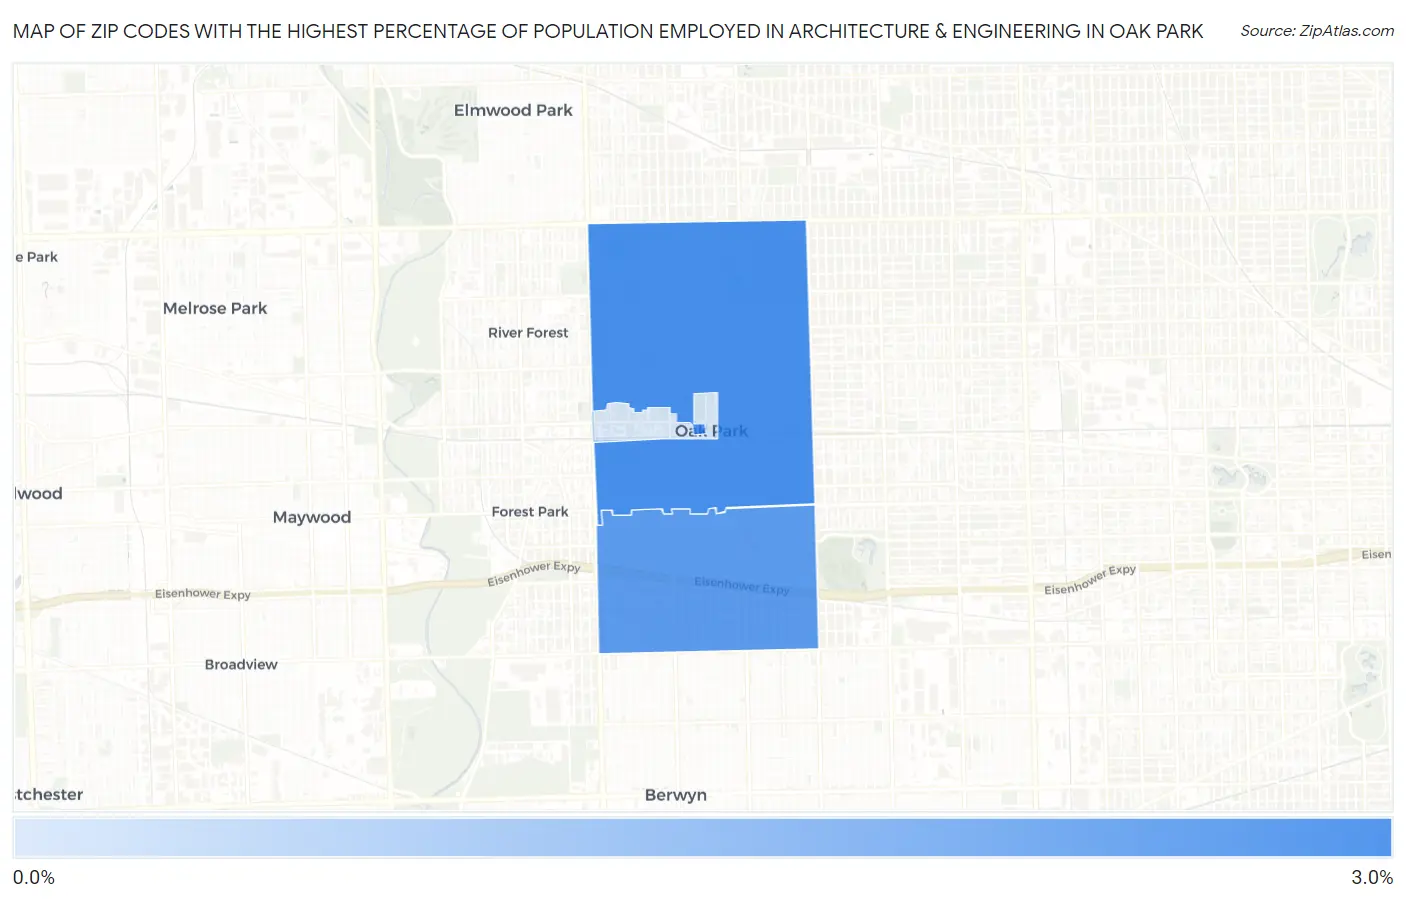
Map of Zip Codes with the Highest Percentage of Population Employed in Architecture & Engineering in Oak Park
0.69%
2.9%
Zip Codes with the Highest Percentage of Population Employed in Architecture & Engineering in Oak Park, IL
| Zip Code | % Employed | vs State | vs National | |
| 1. | 60302 | 2.9% | 1.9%(+0.965)#210 | 2.1%(+0.710)#5,555 |
| 2. | 60304 | 2.5% | 1.9%(+0.647)#265 | 2.1%(+0.393)#6,827 |
| 3. | 60301 | 0.69% | 1.9%(-1.20)#812 | 2.1%(-1.46)#18,944 |
1
Common Questions
What are the Top Zip Codes with the Highest Percentage of Population Employed in Architecture & Engineering in Oak Park, IL?
Top Zip Codes with the Highest Percentage of Population Employed in Architecture & Engineering in Oak Park, IL are:
What zip code has the Highest Percentage of Population Employed in Architecture & Engineering in Oak Park, IL?
60302 has the Highest Percentage of Population Employed in Architecture & Engineering in Oak Park, IL with 2.9%.
What is the Percentage of Population Employed in Architecture & Engineering in Oak Park, IL?
Percentage of Population Employed in Architecture & Engineering in Oak Park is 2.6%.
What is the Percentage of Population Employed in Architecture & Engineering in Illinois?
Percentage of Population Employed in Architecture & Engineering in Illinois is 1.9%.
What is the Percentage of Population Employed in Architecture & Engineering in the United States?
Percentage of Population Employed in Architecture & Engineering in the United States is 2.1%.