Zip Codes with the Highest Percentage of Population Employed in Health Diagnosing & Treating in Oak Park, IL
RELATED REPORTS & OPTIONS
Health Diagnosing & Treating
Oak Park
Compare Zip Codes
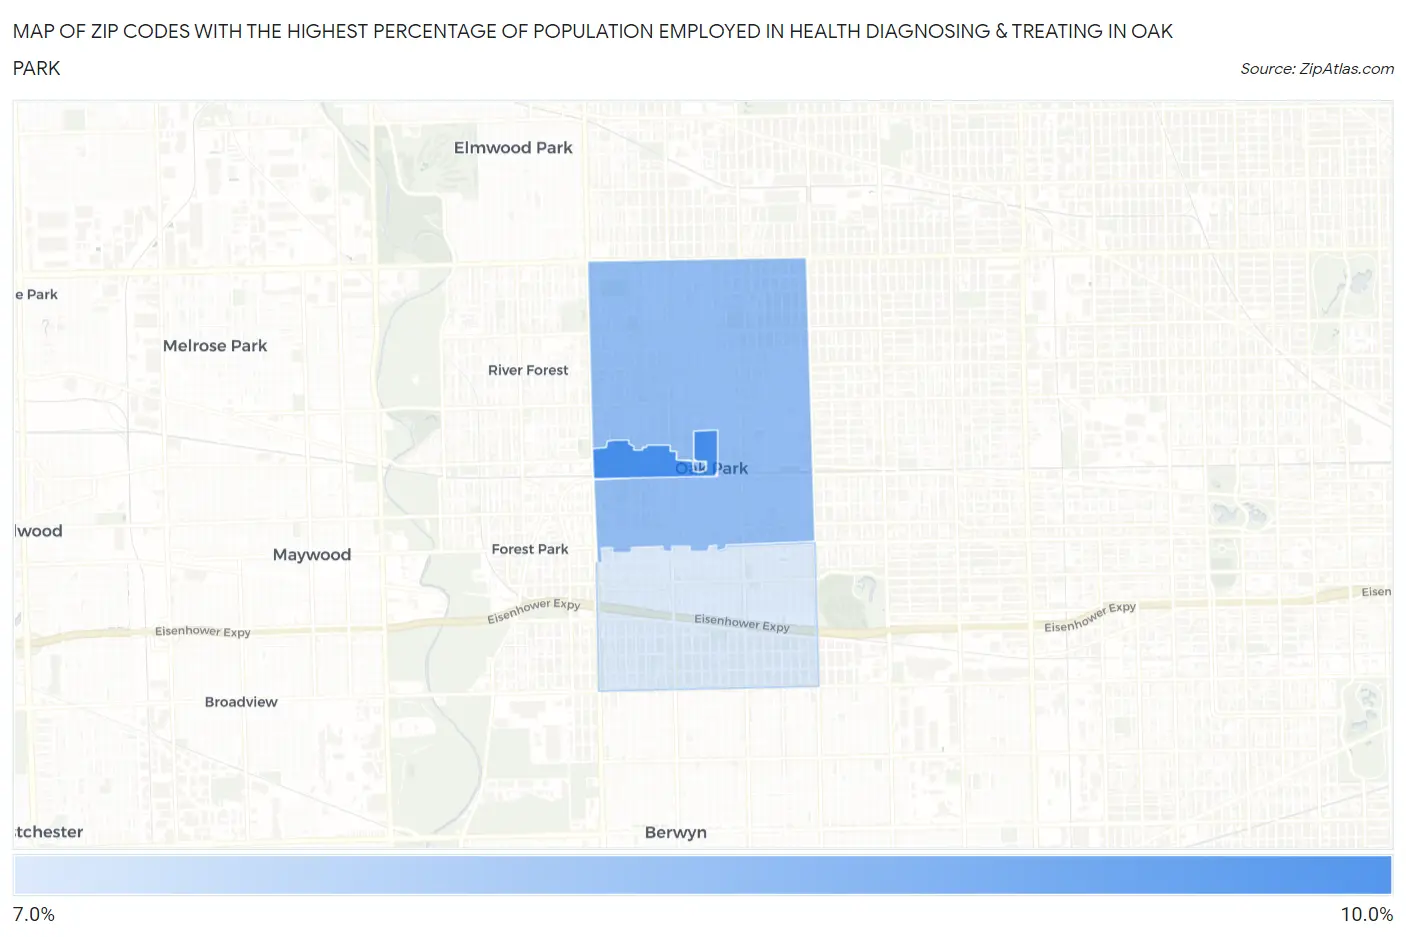
Map of Zip Codes with the Highest Percentage of Population Employed in Health Diagnosing & Treating in Oak Park
7.4%
9.1%
Zip Codes with the Highest Percentage of Population Employed in Health Diagnosing & Treating in Oak Park, IL
| Zip Code | % Employed | vs State | vs National | |
| 1. | 60301 | 9.1% | 6.2%(+2.90)#246 | 6.2%(+2.89)#5,129 |
| 2. | 60302 | 8.3% | 6.2%(+2.04)#337 | 6.2%(+2.04)#6,825 |
| 3. | 60304 | 7.4% | 6.2%(+1.20)#441 | 6.2%(+1.19)#9,006 |
1
Common Questions
What are the Top Zip Codes with the Highest Percentage of Population Employed in Health Diagnosing & Treating in Oak Park, IL?
Top Zip Codes with the Highest Percentage of Population Employed in Health Diagnosing & Treating in Oak Park, IL are:
What zip code has the Highest Percentage of Population Employed in Health Diagnosing & Treating in Oak Park, IL?
60301 has the Highest Percentage of Population Employed in Health Diagnosing & Treating in Oak Park, IL with 9.1%.
What is the Percentage of Population Employed in Health Diagnosing & Treating in Oak Park, IL?
Percentage of Population Employed in Health Diagnosing & Treating in Oak Park is 8.1%.
What is the Percentage of Population Employed in Health Diagnosing & Treating in Illinois?
Percentage of Population Employed in Health Diagnosing & Treating in Illinois is 6.2%.
What is the Percentage of Population Employed in Health Diagnosing & Treating in the United States?
Percentage of Population Employed in Health Diagnosing & Treating in the United States is 6.2%.