Zip Codes with the Highest Percentage of Population with a Degree in Visual and Performing Arts in Oak Park, IL
RELATED REPORTS & OPTIONS
Visual and Performing Arts
Oak Park
Compare Zip Codes
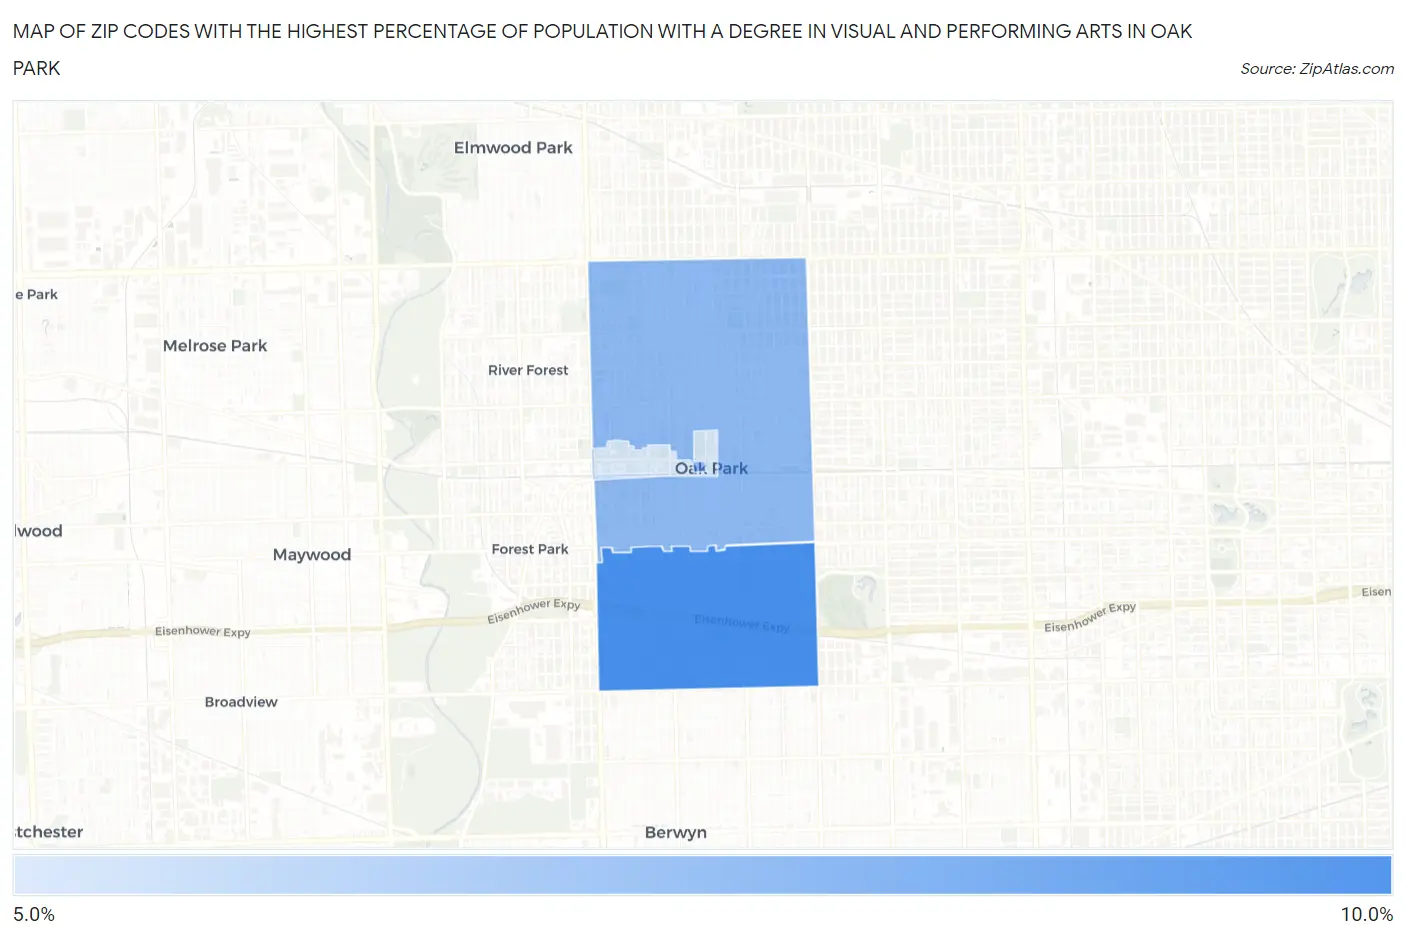
Map of Zip Codes with the Highest Percentage of Population with a Degree in Visual and Performing Arts in Oak Park
5.4%
8.2%
Zip Codes with the Highest Percentage of Population with a Degree in Visual and Performing Arts in Oak Park, IL
| Zip Code | % Graduates | vs State | vs National | |
| 1. | 60304 | 8.2% | 4.4%(+3.70)#104 | 4.3%(+3.90)#2,751 |
| 2. | 60302 | 6.8% | 4.4%(+2.40)#147 | 4.3%(+2.59)#3,827 |
| 3. | 60301 | 5.4% | 4.4%(+0.930)#223 | 4.3%(+1.13)#5,895 |
1
Common Questions
What are the Top Zip Codes with the Highest Percentage of Population with a Degree in Visual and Performing Arts in Oak Park, IL?
Top Zip Codes with the Highest Percentage of Population with a Degree in Visual and Performing Arts in Oak Park, IL are:
What zip code has the Highest Percentage of Population with a Degree in Visual and Performing Arts in Oak Park, IL?
60304 has the Highest Percentage of Population with a Degree in Visual and Performing Arts in Oak Park, IL with 8.2%.
What is the Percentage of Population with a Degree in Visual and Performing Arts in Oak Park, IL?
Percentage of Population with a Degree in Visual and Performing Arts in Oak Park is 7.2%.
What is the Percentage of Population with a Degree in Visual and Performing Arts in Illinois?
Percentage of Population with a Degree in Visual and Performing Arts in Illinois is 4.4%.
What is the Percentage of Population with a Degree in Visual and Performing Arts in the United States?
Percentage of Population with a Degree in Visual and Performing Arts in the United States is 4.3%.