Samoan vs Carpatho Rusyn Married-couple Households
COMPARE
Samoan
Carpatho Rusyn
Married-couple Households
Married-couple Households Comparison
Samoans
Carpatho Rusyns
48.7%
MARRIED-COUPLE HOUSEHOLDS
99.4/ 100
METRIC RATING
50th/ 347
METRIC RANK
45.7%
MARRIED-COUPLE HOUSEHOLDS
15.7/ 100
METRIC RATING
199th/ 347
METRIC RANK
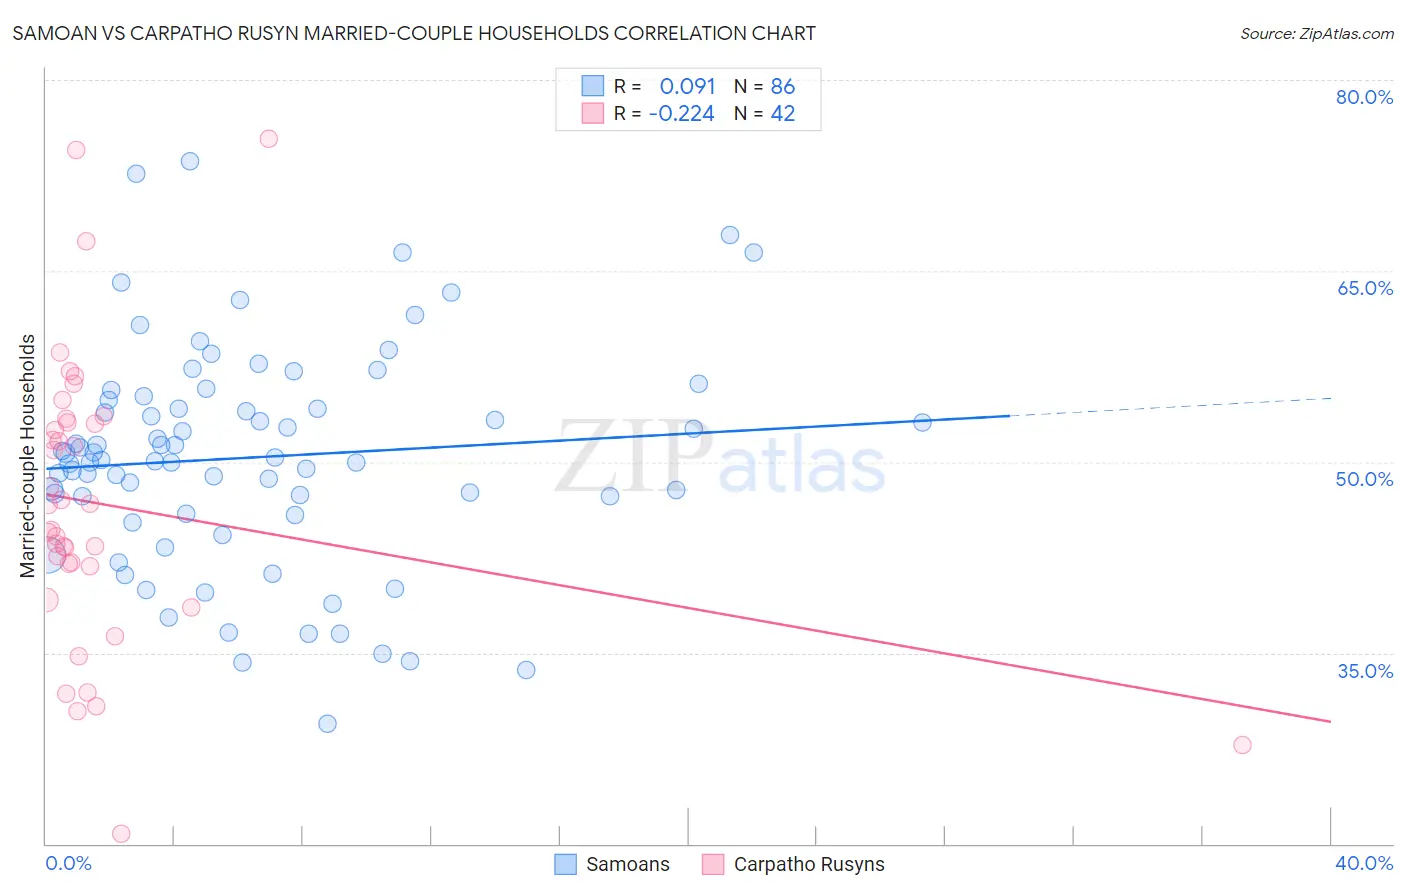
Samoan vs Carpatho Rusyn Married-couple Households Correlation Chart
The statistical analysis conducted on geographies consisting of 225,069,551 people shows a slight positive correlation between the proportion of Samoans and percentage of married-couple family households in the United States with a correlation coefficient (R) of 0.091 and weighted average of 48.7%. Similarly, the statistical analysis conducted on geographies consisting of 58,871,690 people shows a weak negative correlation between the proportion of Carpatho Rusyns and percentage of married-couple family households in the United States with a correlation coefficient (R) of -0.224 and weighted average of 45.7%, a difference of 6.5%.
Married-couple Households Correlation Summary
| Measurement | Samoan | Carpatho Rusyn |
| Minimum | 29.5% | 20.8% |
| Maximum | 73.6% | 75.4% |
| Range | 44.2% | 54.6% |
| Mean | 50.4% | 46.6% |
| Median | 50.2% | 45.7% |
| Interquartile 25% (IQ1) | 45.9% | 41.8% |
| Interquartile 75% (IQ3) | 54.9% | 53.1% |
| Interquartile Range (IQR) | 9.0% | 11.3% |
| Standard Deviation (Sample) | 8.7% | 11.4% |
| Standard Deviation (Population) | 8.7% | 11.3% |
Similar Demographics by Married-couple Households
Demographics Similar to Samoans by Married-couple Households
In terms of married-couple households, the demographic groups most similar to Samoans are Immigrants from Sri Lanka (48.7%, a difference of 0.040%), Eastern European (48.6%, a difference of 0.040%), Irish (48.6%, a difference of 0.080%), Indian (Asian) (48.7%, a difference of 0.10%), and White/Caucasian (48.6%, a difference of 0.13%).
| Demographics | Rating | Rank | Married-couple Households |
| Immigrants | Iran | 99.6 /100 | #43 | Exceptional 48.8% |
| Welsh | 99.5 /100 | #44 | Exceptional 48.8% |
| Immigrants | Eastern Asia | 99.5 /100 | #45 | Exceptional 48.8% |
| Tsimshian | 99.5 /100 | #46 | Exceptional 48.7% |
| British | 99.5 /100 | #47 | Exceptional 48.7% |
| Indians (Asian) | 99.4 /100 | #48 | Exceptional 48.7% |
| Immigrants | Sri Lanka | 99.4 /100 | #49 | Exceptional 48.7% |
| Samoans | 99.4 /100 | #50 | Exceptional 48.7% |
| Eastern Europeans | 99.3 /100 | #51 | Exceptional 48.6% |
| Irish | 99.3 /100 | #52 | Exceptional 48.6% |
| Whites/Caucasians | 99.3 /100 | #53 | Exceptional 48.6% |
| Immigrants | Lithuania | 99.3 /100 | #54 | Exceptional 48.6% |
| Austrians | 99.3 /100 | #55 | Exceptional 48.6% |
| Immigrants | Northern Europe | 99.3 /100 | #56 | Exceptional 48.6% |
| Poles | 99.2 /100 | #57 | Exceptional 48.5% |
Demographics Similar to Carpatho Rusyns by Married-couple Households
In terms of married-couple households, the demographic groups most similar to Carpatho Rusyns are Potawatomi (45.7%, a difference of 0.010%), Immigrants from Serbia (45.7%, a difference of 0.040%), Immigrants from Central America (45.7%, a difference of 0.12%), Alaska Native (45.6%, a difference of 0.21%), and Ottawa (45.8%, a difference of 0.24%).
| Demographics | Rating | Rank | Married-couple Households |
| Immigrants | Northern Africa | 24.6 /100 | #192 | Fair 46.0% |
| Taiwanese | 23.4 /100 | #193 | Fair 45.9% |
| Mexican American Indians | 23.3 /100 | #194 | Fair 45.9% |
| Chickasaw | 22.7 /100 | #195 | Fair 45.9% |
| Immigrants | South America | 22.2 /100 | #196 | Fair 45.9% |
| Cambodians | 21.3 /100 | #197 | Fair 45.9% |
| Ottawa | 19.4 /100 | #198 | Poor 45.8% |
| Carpatho Rusyns | 15.7 /100 | #199 | Poor 45.7% |
| Potawatomi | 15.6 /100 | #200 | Poor 45.7% |
| Immigrants | Serbia | 15.2 /100 | #201 | Poor 45.7% |
| Immigrants | Central America | 14.2 /100 | #202 | Poor 45.7% |
| Alaska Natives | 13.0 /100 | #203 | Poor 45.6% |
| Aleuts | 12.5 /100 | #204 | Poor 45.6% |
| Nepalese | 11.9 /100 | #205 | Poor 45.6% |
| Uruguayans | 10.4 /100 | #206 | Poor 45.5% |