Samoan vs Hispanic or Latino Married-couple Households
COMPARE
Samoan
Hispanic or Latino
Married-couple Households
Married-couple Households Comparison
Samoans
Hispanics or Latinos
48.7%
MARRIED-COUPLE HOUSEHOLDS
99.4/ 100
METRIC RATING
50th/ 347
METRIC RANK
45.4%
MARRIED-COUPLE HOUSEHOLDS
8.7/ 100
METRIC RATING
208th/ 347
METRIC RANK
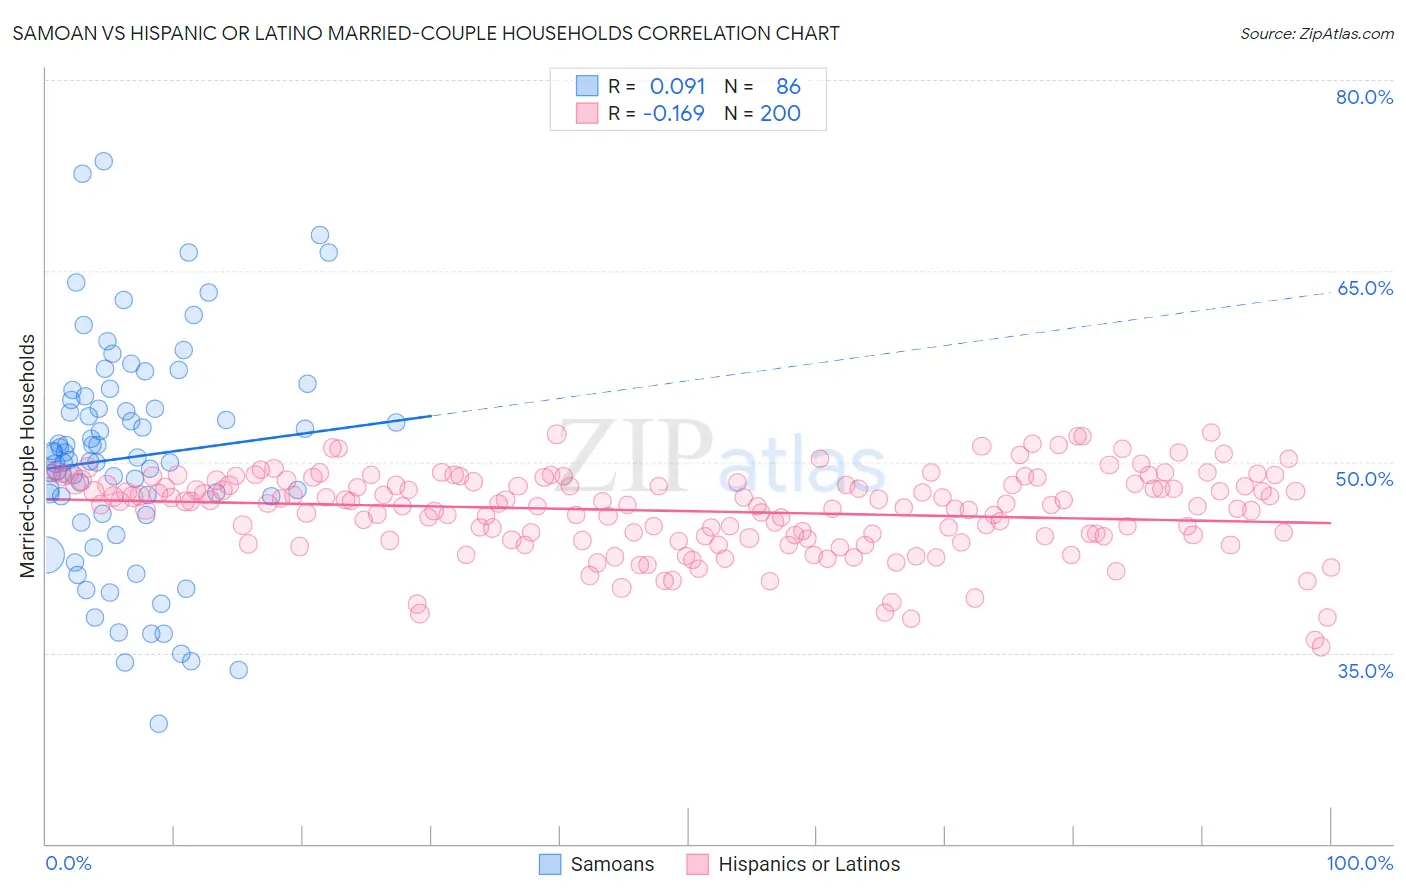
Samoan vs Hispanic or Latino Married-couple Households Correlation Chart
The statistical analysis conducted on geographies consisting of 225,069,551 people shows a slight positive correlation between the proportion of Samoans and percentage of married-couple family households in the United States with a correlation coefficient (R) of 0.091 and weighted average of 48.7%. Similarly, the statistical analysis conducted on geographies consisting of 576,946,669 people shows a poor negative correlation between the proportion of Hispanics or Latinos and percentage of married-couple family households in the United States with a correlation coefficient (R) of -0.169 and weighted average of 45.4%, a difference of 7.1%.
Married-couple Households Correlation Summary
| Measurement | Samoan | Hispanic or Latino |
| Minimum | 29.5% | 35.5% |
| Maximum | 73.6% | 52.3% |
| Range | 44.2% | 16.9% |
| Mean | 50.4% | 46.1% |
| Median | 50.2% | 46.7% |
| Interquartile 25% (IQ1) | 45.9% | 44.2% |
| Interquartile 75% (IQ3) | 54.9% | 48.3% |
| Interquartile Range (IQR) | 9.0% | 4.2% |
| Standard Deviation (Sample) | 8.7% | 3.2% |
| Standard Deviation (Population) | 8.7% | 3.2% |
Similar Demographics by Married-couple Households
Demographics Similar to Samoans by Married-couple Households
In terms of married-couple households, the demographic groups most similar to Samoans are Immigrants from Sri Lanka (48.7%, a difference of 0.040%), Eastern European (48.6%, a difference of 0.040%), Irish (48.6%, a difference of 0.080%), Indian (Asian) (48.7%, a difference of 0.10%), and White/Caucasian (48.6%, a difference of 0.13%).
| Demographics | Rating | Rank | Married-couple Households |
| Immigrants | Iran | 99.6 /100 | #43 | Exceptional 48.8% |
| Welsh | 99.5 /100 | #44 | Exceptional 48.8% |
| Immigrants | Eastern Asia | 99.5 /100 | #45 | Exceptional 48.8% |
| Tsimshian | 99.5 /100 | #46 | Exceptional 48.7% |
| British | 99.5 /100 | #47 | Exceptional 48.7% |
| Indians (Asian) | 99.4 /100 | #48 | Exceptional 48.7% |
| Immigrants | Sri Lanka | 99.4 /100 | #49 | Exceptional 48.7% |
| Samoans | 99.4 /100 | #50 | Exceptional 48.7% |
| Eastern Europeans | 99.3 /100 | #51 | Exceptional 48.6% |
| Irish | 99.3 /100 | #52 | Exceptional 48.6% |
| Whites/Caucasians | 99.3 /100 | #53 | Exceptional 48.6% |
| Immigrants | Lithuania | 99.3 /100 | #54 | Exceptional 48.6% |
| Austrians | 99.3 /100 | #55 | Exceptional 48.6% |
| Immigrants | Northern Europe | 99.3 /100 | #56 | Exceptional 48.6% |
| Poles | 99.2 /100 | #57 | Exceptional 48.5% |
Demographics Similar to Hispanics or Latinos by Married-couple Households
In terms of married-couple households, the demographic groups most similar to Hispanics or Latinos are Immigrants from France (45.4%, a difference of 0.010%), Immigrants from Uzbekistan (45.4%, a difference of 0.040%), Cuban (45.4%, a difference of 0.13%), Uruguayan (45.5%, a difference of 0.19%), and Immigrants from Spain (45.3%, a difference of 0.19%).
| Demographics | Rating | Rank | Married-couple Households |
| Immigrants | Serbia | 15.2 /100 | #201 | Poor 45.7% |
| Immigrants | Central America | 14.2 /100 | #202 | Poor 45.7% |
| Alaska Natives | 13.0 /100 | #203 | Poor 45.6% |
| Aleuts | 12.5 /100 | #204 | Poor 45.6% |
| Nepalese | 11.9 /100 | #205 | Poor 45.6% |
| Uruguayans | 10.4 /100 | #206 | Poor 45.5% |
| Immigrants | France | 8.8 /100 | #207 | Tragic 45.4% |
| Hispanics or Latinos | 8.7 /100 | #208 | Tragic 45.4% |
| Immigrants | Uzbekistan | 8.4 /100 | #209 | Tragic 45.4% |
| Cubans | 7.7 /100 | #210 | Tragic 45.4% |
| Immigrants | Spain | 7.3 /100 | #211 | Tragic 45.3% |
| Creek | 6.4 /100 | #212 | Tragic 45.3% |
| Yakama | 5.8 /100 | #213 | Tragic 45.2% |
| Japanese | 5.7 /100 | #214 | Tragic 45.2% |
| Immigrants | Nepal | 5.6 /100 | #215 | Tragic 45.2% |