Paiute vs Alsatian Married-couple Households
COMPARE
Paiute
Alsatian
Married-couple Households
Married-couple Households Comparison
Paiute
Alsatians
42.1%
MARRIED-COUPLE HOUSEHOLDS
0.0/ 100
METRIC RATING
291st/ 347
METRIC RANK
44.8%
MARRIED-COUPLE HOUSEHOLDS
2.3/ 100
METRIC RATING
226th/ 347
METRIC RANK
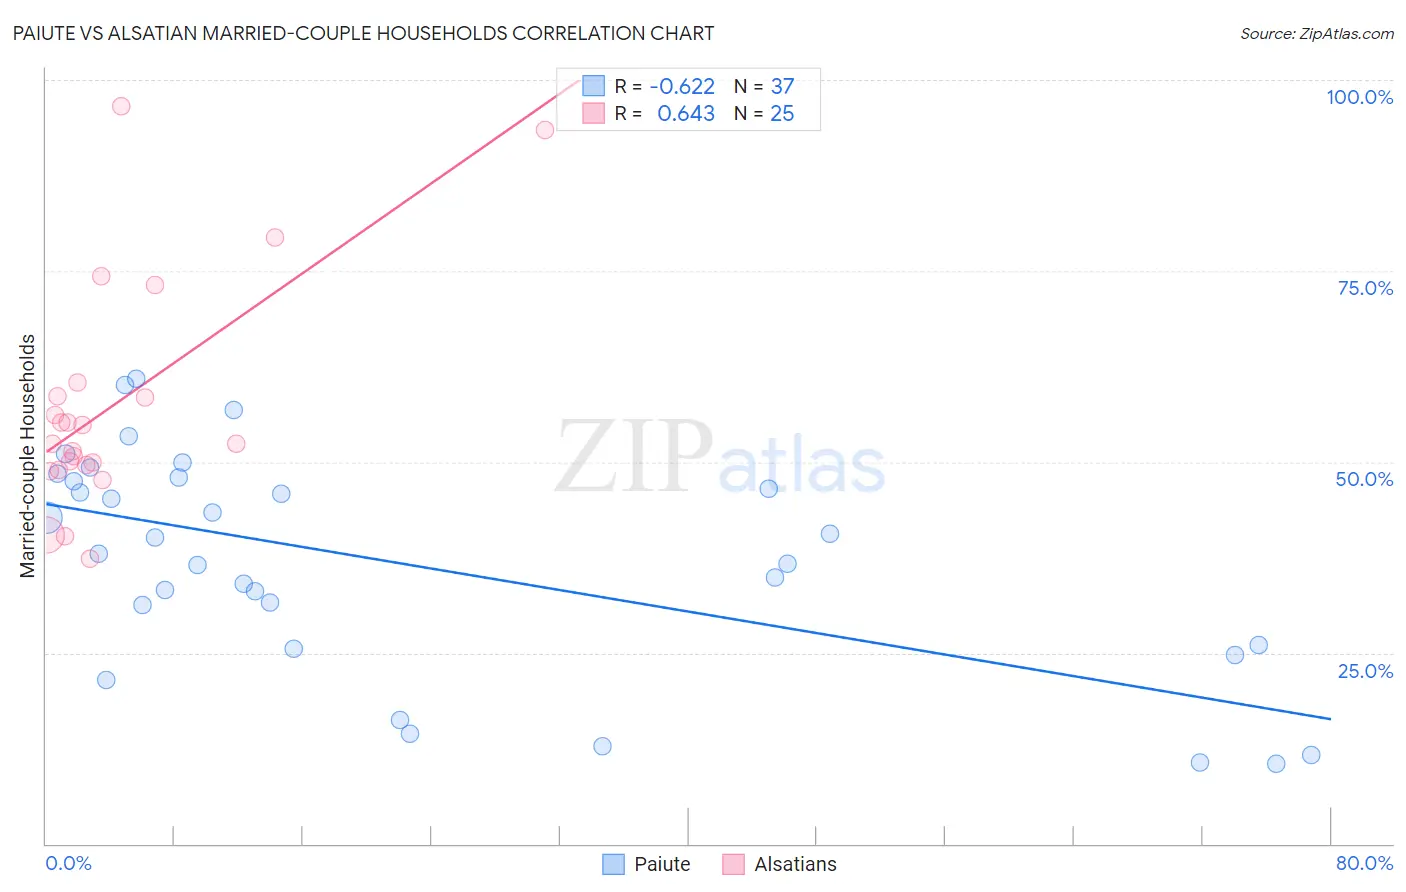
Paiute vs Alsatian Married-couple Households Correlation Chart
The statistical analysis conducted on geographies consisting of 58,392,111 people shows a significant negative correlation between the proportion of Paiute and percentage of married-couple family households in the United States with a correlation coefficient (R) of -0.622 and weighted average of 42.1%. Similarly, the statistical analysis conducted on geographies consisting of 82,680,020 people shows a significant positive correlation between the proportion of Alsatians and percentage of married-couple family households in the United States with a correlation coefficient (R) of 0.643 and weighted average of 44.8%, a difference of 6.6%.
Married-couple Households Correlation Summary
| Measurement | Paiute | Alsatian |
| Minimum | 10.5% | 37.3% |
| Maximum | 60.9% | 96.6% |
| Range | 50.4% | 59.3% |
| Mean | 36.7% | 57.4% |
| Median | 38.0% | 52.4% |
| Interquartile 25% (IQ1) | 25.8% | 49.3% |
| Interquartile 75% (IQ3) | 47.7% | 59.5% |
| Interquartile Range (IQR) | 21.9% | 10.2% |
| Standard Deviation (Sample) | 14.3% | 15.0% |
| Standard Deviation (Population) | 14.1% | 14.7% |
Similar Demographics by Married-couple Households
Demographics Similar to Paiute by Married-couple Households
In terms of married-couple households, the demographic groups most similar to Paiute are Honduran (42.1%, a difference of 0.010%), Indonesian (42.0%, a difference of 0.050%), Sudanese (42.1%, a difference of 0.060%), Immigrants from Eritrea (42.1%, a difference of 0.11%), and Menominee (42.0%, a difference of 0.16%).
| Demographics | Rating | Rank | Married-couple Households |
| Cheyenne | 0.0 /100 | #284 | Tragic 42.3% |
| Ghanaians | 0.0 /100 | #285 | Tragic 42.2% |
| Belizeans | 0.0 /100 | #286 | Tragic 42.2% |
| Chippewa | 0.0 /100 | #287 | Tragic 42.1% |
| Immigrants | Eritrea | 0.0 /100 | #288 | Tragic 42.1% |
| Sudanese | 0.0 /100 | #289 | Tragic 42.1% |
| Hondurans | 0.0 /100 | #290 | Tragic 42.1% |
| Paiute | 0.0 /100 | #291 | Tragic 42.1% |
| Indonesians | 0.0 /100 | #292 | Tragic 42.0% |
| Menominee | 0.0 /100 | #293 | Tragic 42.0% |
| Immigrants | Yemen | 0.0 /100 | #294 | Tragic 42.0% |
| Kiowa | 0.0 /100 | #295 | Tragic 42.0% |
| Immigrants | Sudan | 0.0 /100 | #296 | Tragic 41.9% |
| Arapaho | 0.0 /100 | #297 | Tragic 41.8% |
| Immigrants | Middle Africa | 0.0 /100 | #298 | Tragic 41.8% |
Demographics Similar to Alsatians by Married-couple Households
In terms of married-couple households, the demographic groups most similar to Alsatians are Dutch West Indian (44.9%, a difference of 0.10%), Immigrants from Micronesia (44.9%, a difference of 0.12%), Immigrants from Cambodia (44.9%, a difference of 0.14%), Salvadoran (44.7%, a difference of 0.19%), and Kenyan (44.7%, a difference of 0.32%).
| Demographics | Rating | Rank | Married-couple Households |
| Nicaraguans | 5.3 /100 | #219 | Tragic 45.2% |
| Immigrants | Thailand | 5.1 /100 | #220 | Tragic 45.2% |
| Tlingit-Haida | 4.9 /100 | #221 | Tragic 45.1% |
| Immigrants | Laos | 4.6 /100 | #222 | Tragic 45.1% |
| Immigrants | Cambodia | 2.7 /100 | #223 | Tragic 44.9% |
| Immigrants | Micronesia | 2.6 /100 | #224 | Tragic 44.9% |
| Dutch West Indians | 2.6 /100 | #225 | Tragic 44.9% |
| Alsatians | 2.3 /100 | #226 | Tragic 44.8% |
| Salvadorans | 1.9 /100 | #227 | Tragic 44.7% |
| Kenyans | 1.7 /100 | #228 | Tragic 44.7% |
| Immigrants | Latin America | 1.6 /100 | #229 | Tragic 44.7% |
| Soviet Union | 1.6 /100 | #230 | Tragic 44.6% |
| Houma | 1.5 /100 | #231 | Tragic 44.6% |
| Marshallese | 1.5 /100 | #232 | Tragic 44.6% |
| Immigrants | Uganda | 1.5 /100 | #233 | Tragic 44.6% |