Paiute vs Japanese Married-couple Households
COMPARE
Paiute
Japanese
Married-couple Households
Married-couple Households Comparison
Paiute
Japanese
42.1%
MARRIED-COUPLE HOUSEHOLDS
0.0/ 100
METRIC RATING
291st/ 347
METRIC RANK
45.2%
MARRIED-COUPLE HOUSEHOLDS
5.7/ 100
METRIC RATING
214th/ 347
METRIC RANK
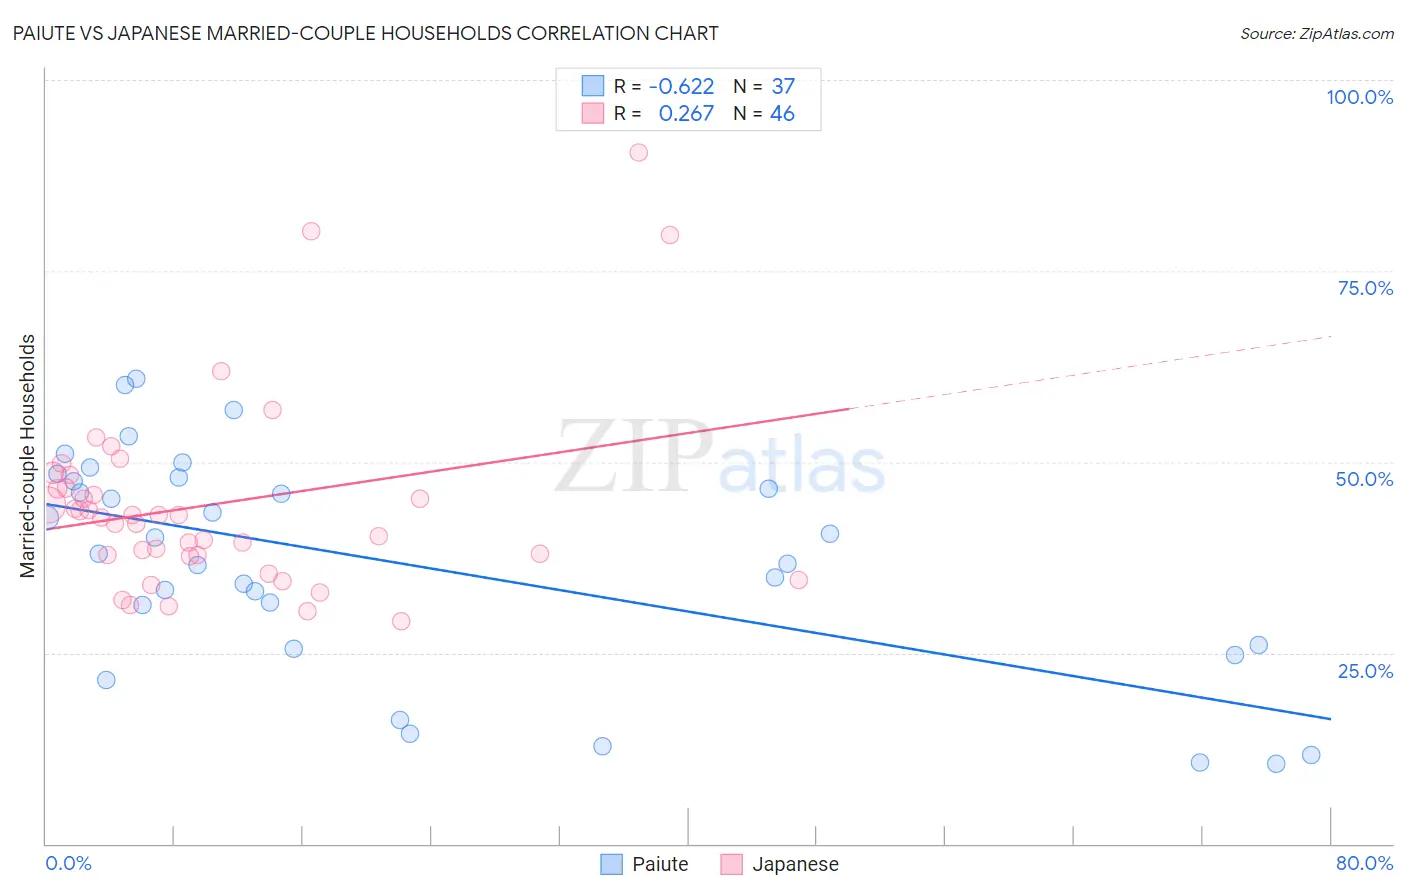
Paiute vs Japanese Married-couple Households Correlation Chart
The statistical analysis conducted on geographies consisting of 58,392,111 people shows a significant negative correlation between the proportion of Paiute and percentage of married-couple family households in the United States with a correlation coefficient (R) of -0.622 and weighted average of 42.1%. Similarly, the statistical analysis conducted on geographies consisting of 249,071,577 people shows a weak positive correlation between the proportion of Japanese and percentage of married-couple family households in the United States with a correlation coefficient (R) of 0.267 and weighted average of 45.2%, a difference of 7.5%.
Married-couple Households Correlation Summary
| Measurement | Paiute | Japanese |
| Minimum | 10.5% | 29.2% |
| Maximum | 60.9% | 90.5% |
| Range | 50.4% | 61.3% |
| Mean | 36.7% | 44.4% |
| Median | 38.0% | 42.9% |
| Interquartile 25% (IQ1) | 25.8% | 37.8% |
| Interquartile 75% (IQ3) | 47.7% | 46.6% |
| Interquartile Range (IQR) | 21.9% | 8.8% |
| Standard Deviation (Sample) | 14.3% | 12.6% |
| Standard Deviation (Population) | 14.1% | 12.5% |
Similar Demographics by Married-couple Households
Demographics Similar to Paiute by Married-couple Households
In terms of married-couple households, the demographic groups most similar to Paiute are Honduran (42.1%, a difference of 0.010%), Indonesian (42.0%, a difference of 0.050%), Sudanese (42.1%, a difference of 0.060%), Immigrants from Eritrea (42.1%, a difference of 0.11%), and Menominee (42.0%, a difference of 0.16%).
| Demographics | Rating | Rank | Married-couple Households |
| Cheyenne | 0.0 /100 | #284 | Tragic 42.3% |
| Ghanaians | 0.0 /100 | #285 | Tragic 42.2% |
| Belizeans | 0.0 /100 | #286 | Tragic 42.2% |
| Chippewa | 0.0 /100 | #287 | Tragic 42.1% |
| Immigrants | Eritrea | 0.0 /100 | #288 | Tragic 42.1% |
| Sudanese | 0.0 /100 | #289 | Tragic 42.1% |
| Hondurans | 0.0 /100 | #290 | Tragic 42.1% |
| Paiute | 0.0 /100 | #291 | Tragic 42.1% |
| Indonesians | 0.0 /100 | #292 | Tragic 42.0% |
| Menominee | 0.0 /100 | #293 | Tragic 42.0% |
| Immigrants | Yemen | 0.0 /100 | #294 | Tragic 42.0% |
| Kiowa | 0.0 /100 | #295 | Tragic 42.0% |
| Immigrants | Sudan | 0.0 /100 | #296 | Tragic 41.9% |
| Arapaho | 0.0 /100 | #297 | Tragic 41.8% |
| Immigrants | Middle Africa | 0.0 /100 | #298 | Tragic 41.8% |
Demographics Similar to Japanese by Married-couple Households
In terms of married-couple households, the demographic groups most similar to Japanese are Yakama (45.2%, a difference of 0.020%), Immigrants from Nepal (45.2%, a difference of 0.020%), Immigrants from Portugal (45.2%, a difference of 0.020%), Panamanian (45.2%, a difference of 0.040%), and Immigrants from the Azores (45.2%, a difference of 0.070%).
| Demographics | Rating | Rank | Married-couple Households |
| Immigrants | France | 8.8 /100 | #207 | Tragic 45.4% |
| Hispanics or Latinos | 8.7 /100 | #208 | Tragic 45.4% |
| Immigrants | Uzbekistan | 8.4 /100 | #209 | Tragic 45.4% |
| Cubans | 7.7 /100 | #210 | Tragic 45.4% |
| Immigrants | Spain | 7.3 /100 | #211 | Tragic 45.3% |
| Creek | 6.4 /100 | #212 | Tragic 45.3% |
| Yakama | 5.8 /100 | #213 | Tragic 45.2% |
| Japanese | 5.7 /100 | #214 | Tragic 45.2% |
| Immigrants | Nepal | 5.6 /100 | #215 | Tragic 45.2% |
| Immigrants | Portugal | 5.6 /100 | #216 | Tragic 45.2% |
| Panamanians | 5.5 /100 | #217 | Tragic 45.2% |
| Immigrants | Azores | 5.3 /100 | #218 | Tragic 45.2% |
| Nicaraguans | 5.3 /100 | #219 | Tragic 45.2% |
| Immigrants | Thailand | 5.1 /100 | #220 | Tragic 45.2% |
| Tlingit-Haida | 4.9 /100 | #221 | Tragic 45.1% |