Immigrants from Hungary vs Arab Married-couple Households
COMPARE
Immigrants from Hungary
Arab
Married-couple Households
Married-couple Households Comparison
Immigrants from Hungary
Arabs
47.3%
MARRIED-COUPLE HOUSEHOLDS
87.8/ 100
METRIC RATING
130th/ 347
METRIC RANK
46.9%
MARRIED-COUPLE HOUSEHOLDS
76.0/ 100
METRIC RATING
155th/ 347
METRIC RANK
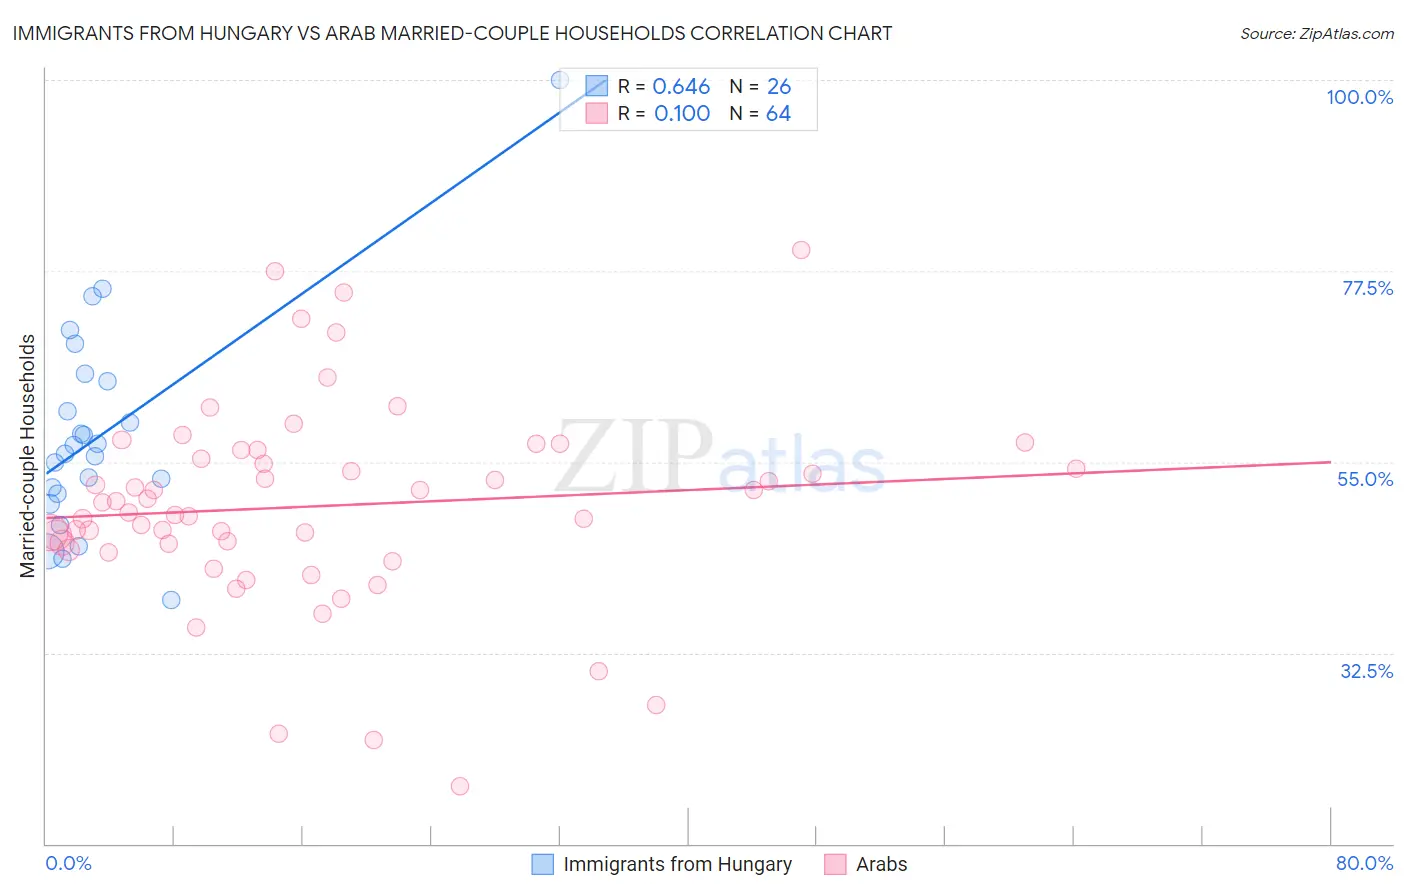
Immigrants from Hungary vs Arab Married-couple Households Correlation Chart
The statistical analysis conducted on geographies consisting of 195,664,672 people shows a significant positive correlation between the proportion of Immigrants from Hungary and percentage of married-couple family households in the United States with a correlation coefficient (R) of 0.646 and weighted average of 47.3%. Similarly, the statistical analysis conducted on geographies consisting of 486,357,143 people shows a slight positive correlation between the proportion of Arabs and percentage of married-couple family households in the United States with a correlation coefficient (R) of 0.100 and weighted average of 46.9%, a difference of 0.76%.
Married-couple Households Correlation Summary
| Measurement | Immigrants from Hungary | Arab |
| Minimum | 38.7% | 16.8% |
| Maximum | 100.0% | 80.0% |
| Range | 61.3% | 63.2% |
| Mean | 58.3% | 49.8% |
| Median | 56.5% | 49.6% |
| Interquartile 25% (IQ1) | 51.2% | 45.0% |
| Interquartile 75% (IQ3) | 64.5% | 55.9% |
| Interquartile Range (IQR) | 13.2% | 11.0% |
| Standard Deviation (Sample) | 12.6% | 11.9% |
| Standard Deviation (Population) | 12.4% | 11.8% |
Similar Demographics by Married-couple Households
Demographics Similar to Immigrants from Hungary by Married-couple Households
In terms of married-couple households, the demographic groups most similar to Immigrants from Hungary are Immigrants from Iraq (47.3%, a difference of 0.0%), Immigrants from Peru (47.3%, a difference of 0.010%), Immigrants from Denmark (47.3%, a difference of 0.020%), Celtic (47.3%, a difference of 0.030%), and Pakistani (47.3%, a difference of 0.070%).
| Demographics | Rating | Rank | Married-couple Households |
| Immigrants | Venezuela | 89.3 /100 | #123 | Excellent 47.4% |
| Zimbabweans | 89.2 /100 | #124 | Excellent 47.4% |
| Australians | 89.0 /100 | #125 | Excellent 47.4% |
| Pakistanis | 88.6 /100 | #126 | Excellent 47.3% |
| Celtics | 88.1 /100 | #127 | Excellent 47.3% |
| Immigrants | Peru | 87.9 /100 | #128 | Excellent 47.3% |
| Immigrants | Iraq | 87.8 /100 | #129 | Excellent 47.3% |
| Immigrants | Hungary | 87.8 /100 | #130 | Excellent 47.3% |
| Immigrants | Denmark | 87.5 /100 | #131 | Excellent 47.3% |
| Immigrants | Ukraine | 86.7 /100 | #132 | Excellent 47.3% |
| South Africans | 86.4 /100 | #133 | Excellent 47.3% |
| Immigrants | Greece | 86.0 /100 | #134 | Excellent 47.2% |
| Immigrants | Argentina | 86.0 /100 | #135 | Excellent 47.2% |
| New Zealanders | 85.3 /100 | #136 | Excellent 47.2% |
| Immigrants | Malaysia | 85.2 /100 | #137 | Excellent 47.2% |
Demographics Similar to Arabs by Married-couple Households
In terms of married-couple households, the demographic groups most similar to Arabs are Hmong (47.0%, a difference of 0.010%), Immigrants from Western Asia (46.9%, a difference of 0.010%), Serbian (47.0%, a difference of 0.020%), Armenian (46.9%, a difference of 0.030%), and Immigrants from Bulgaria (47.0%, a difference of 0.040%).
| Demographics | Rating | Rank | Married-couple Households |
| Icelanders | 79.5 /100 | #148 | Good 47.0% |
| Paraguayans | 78.7 /100 | #149 | Good 47.0% |
| Immigrants | Russia | 77.6 /100 | #150 | Good 47.0% |
| Immigrants | Bulgaria | 76.8 /100 | #151 | Good 47.0% |
| Serbians | 76.3 /100 | #152 | Good 47.0% |
| Hmong | 76.2 /100 | #153 | Good 47.0% |
| Immigrants | Western Asia | 76.1 /100 | #154 | Good 46.9% |
| Arabs | 76.0 /100 | #155 | Good 46.9% |
| Armenians | 75.4 /100 | #156 | Good 46.9% |
| Immigrants | Oceania | 74.8 /100 | #157 | Good 46.9% |
| Immigrants | Nonimmigrants | 73.3 /100 | #158 | Good 46.9% |
| Osage | 73.2 /100 | #159 | Good 46.9% |
| Iraqis | 71.7 /100 | #160 | Good 46.9% |
| Delaware | 71.2 /100 | #161 | Good 46.8% |
| Colombians | 71.0 /100 | #162 | Good 46.8% |