Nicaraguan vs Puerto Rican GED/Equivalency
COMPARE
Nicaraguan
Puerto Rican
GED/Equivalency
GED/Equivalency Comparison
Nicaraguans
Puerto Ricans
80.9%
GED/EQUIVALENCY
0.0/ 100
METRIC RATING
312th/ 347
METRIC RANK
81.1%
GED/EQUIVALENCY
0.0/ 100
METRIC RATING
308th/ 347
METRIC RANK
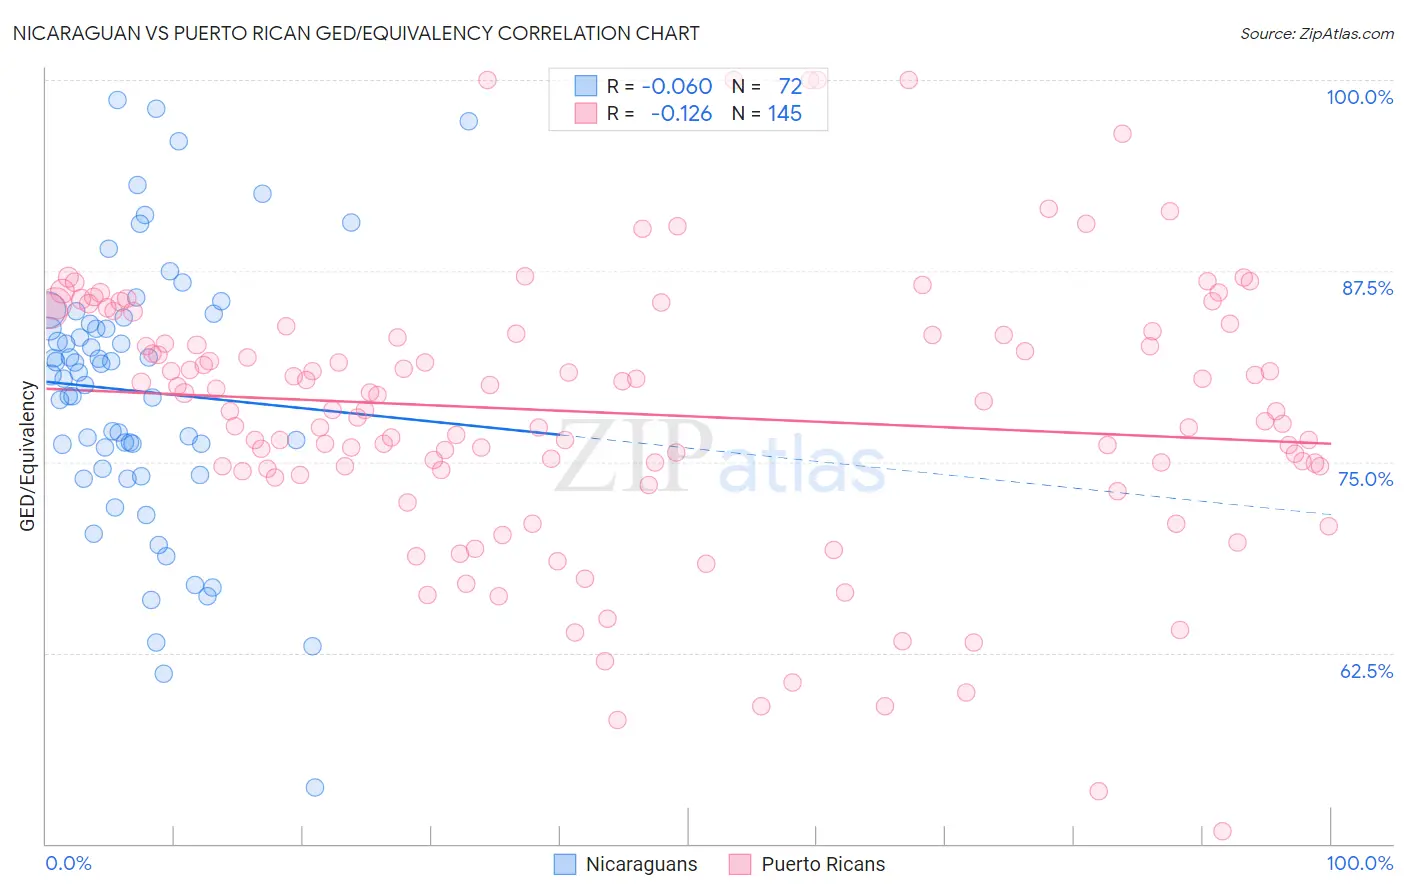
Nicaraguan vs Puerto Rican GED/Equivalency Correlation Chart
The statistical analysis conducted on geographies consisting of 285,710,633 people shows a slight negative correlation between the proportion of Nicaraguans and percentage of population with at least ged/equivalency education in the United States with a correlation coefficient (R) of -0.060 and weighted average of 80.9%. Similarly, the statistical analysis conducted on geographies consisting of 528,320,760 people shows a poor negative correlation between the proportion of Puerto Ricans and percentage of population with at least ged/equivalency education in the United States with a correlation coefficient (R) of -0.126 and weighted average of 81.1%, a difference of 0.18%.
GED/Equivalency Correlation Summary
| Measurement | Nicaraguan | Puerto Rican |
| Minimum | 53.7% | 50.8% |
| Maximum | 98.7% | 100.0% |
| Range | 45.0% | 49.2% |
| Mean | 79.6% | 78.2% |
| Median | 80.7% | 78.4% |
| Interquartile 25% (IQ1) | 75.3% | 74.5% |
| Interquartile 75% (IQ3) | 84.2% | 83.5% |
| Interquartile Range (IQR) | 9.0% | 9.0% |
| Standard Deviation (Sample) | 8.8% | 9.0% |
| Standard Deviation (Population) | 8.7% | 8.9% |
Demographics Similar to Nicaraguans and Puerto Ricans by GED/Equivalency
In terms of ged/equivalency, the demographic groups most similar to Nicaraguans are Cape Verdean (80.9%, a difference of 0.0%), Belizean (80.9%, a difference of 0.020%), Immigrants from Guyana (81.0%, a difference of 0.040%), Native/Alaskan (80.9%, a difference of 0.040%), and Immigrants from Ecuador (81.0%, a difference of 0.10%). Similarly, the demographic groups most similar to Puerto Ricans are Immigrants from Ecuador (81.0%, a difference of 0.080%), Immigrants from Dominica (81.1%, a difference of 0.10%), Immigrants from Guyana (81.0%, a difference of 0.14%), Native/Alaskan (80.9%, a difference of 0.14%), and Cape Verdean (80.9%, a difference of 0.18%).
| Demographics | Rating | Rank | GED/Equivalency |
| Fijians | 0.0 /100 | #300 | Tragic 81.6% |
| Dutch West Indians | 0.0 /100 | #301 | Tragic 81.6% |
| Immigrants | Haiti | 0.0 /100 | #302 | Tragic 81.6% |
| Immigrants | Portugal | 0.0 /100 | #303 | Tragic 81.6% |
| Navajo | 0.0 /100 | #304 | Tragic 81.5% |
| Immigrants | Grenada | 0.0 /100 | #305 | Tragic 81.3% |
| Guyanese | 0.0 /100 | #306 | Tragic 81.3% |
| Immigrants | Dominica | 0.0 /100 | #307 | Tragic 81.1% |
| Puerto Ricans | 0.0 /100 | #308 | Tragic 81.1% |
| Immigrants | Ecuador | 0.0 /100 | #309 | Tragic 81.0% |
| Immigrants | Guyana | 0.0 /100 | #310 | Tragic 81.0% |
| Natives/Alaskans | 0.0 /100 | #311 | Tragic 80.9% |
| Nicaraguans | 0.0 /100 | #312 | Tragic 80.9% |
| Cape Verdeans | 0.0 /100 | #313 | Tragic 80.9% |
| Belizeans | 0.0 /100 | #314 | Tragic 80.9% |
| Apache | 0.0 /100 | #315 | Tragic 80.7% |
| Central American Indians | 0.0 /100 | #316 | Tragic 80.6% |
| Immigrants | Caribbean | 0.0 /100 | #317 | Tragic 80.5% |
| Yaqui | 0.0 /100 | #318 | Tragic 80.5% |
| Immigrants | Belize | 0.0 /100 | #319 | Tragic 80.5% |
| Immigrants | Cuba | 0.0 /100 | #320 | Tragic 80.2% |