Nicaraguan vs Austrian GED/Equivalency
COMPARE
Nicaraguan
Austrian
GED/Equivalency
GED/Equivalency Comparison
Nicaraguans
Austrians
80.9%
GED/EQUIVALENCY
0.0/ 100
METRIC RATING
312th/ 347
METRIC RANK
87.7%
GED/EQUIVALENCY
98.8/ 100
METRIC RATING
71st/ 347
METRIC RANK
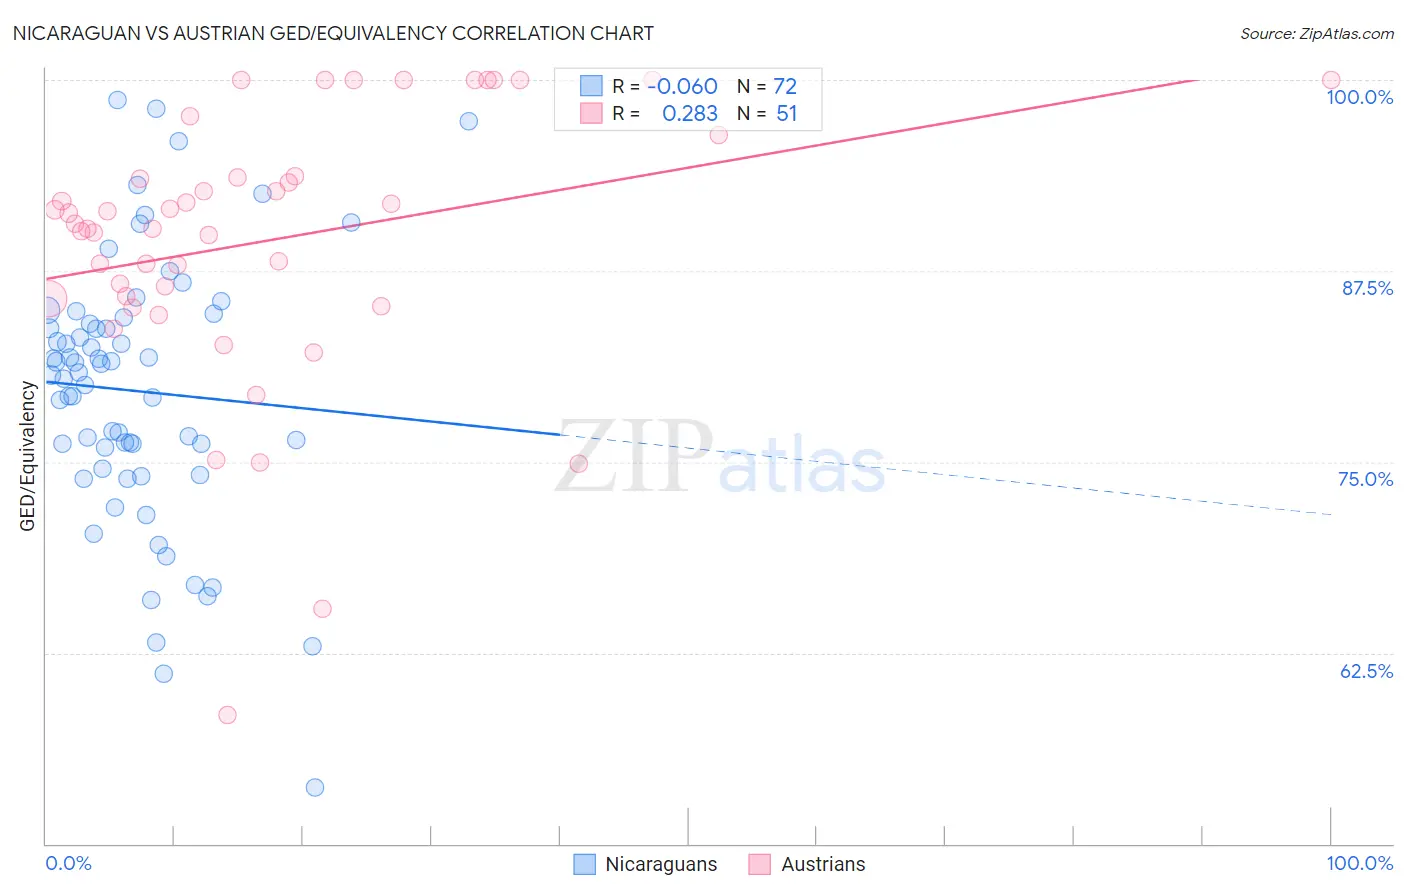
Nicaraguan vs Austrian GED/Equivalency Correlation Chart
The statistical analysis conducted on geographies consisting of 285,710,633 people shows a slight negative correlation between the proportion of Nicaraguans and percentage of population with at least ged/equivalency education in the United States with a correlation coefficient (R) of -0.060 and weighted average of 80.9%. Similarly, the statistical analysis conducted on geographies consisting of 452,082,927 people shows a weak positive correlation between the proportion of Austrians and percentage of population with at least ged/equivalency education in the United States with a correlation coefficient (R) of 0.283 and weighted average of 87.7%, a difference of 8.4%.
GED/Equivalency Correlation Summary
| Measurement | Nicaraguan | Austrian |
| Minimum | 53.7% | 58.5% |
| Maximum | 98.7% | 100.0% |
| Range | 45.0% | 41.5% |
| Mean | 79.6% | 89.5% |
| Median | 80.7% | 90.6% |
| Interquartile 25% (IQ1) | 75.3% | 85.7% |
| Interquartile 75% (IQ3) | 84.2% | 93.7% |
| Interquartile Range (IQR) | 9.0% | 8.0% |
| Standard Deviation (Sample) | 8.8% | 8.8% |
| Standard Deviation (Population) | 8.7% | 8.7% |
Similar Demographics by GED/Equivalency
Demographics Similar to Nicaraguans by GED/Equivalency
In terms of ged/equivalency, the demographic groups most similar to Nicaraguans are Cape Verdean (80.9%, a difference of 0.0%), Belizean (80.9%, a difference of 0.020%), Immigrants from Guyana (81.0%, a difference of 0.040%), Native/Alaskan (80.9%, a difference of 0.040%), and Immigrants from Ecuador (81.0%, a difference of 0.10%).
| Demographics | Rating | Rank | GED/Equivalency |
| Immigrants | Grenada | 0.0 /100 | #305 | Tragic 81.3% |
| Guyanese | 0.0 /100 | #306 | Tragic 81.3% |
| Immigrants | Dominica | 0.0 /100 | #307 | Tragic 81.1% |
| Puerto Ricans | 0.0 /100 | #308 | Tragic 81.1% |
| Immigrants | Ecuador | 0.0 /100 | #309 | Tragic 81.0% |
| Immigrants | Guyana | 0.0 /100 | #310 | Tragic 81.0% |
| Natives/Alaskans | 0.0 /100 | #311 | Tragic 80.9% |
| Nicaraguans | 0.0 /100 | #312 | Tragic 80.9% |
| Cape Verdeans | 0.0 /100 | #313 | Tragic 80.9% |
| Belizeans | 0.0 /100 | #314 | Tragic 80.9% |
| Apache | 0.0 /100 | #315 | Tragic 80.7% |
| Central American Indians | 0.0 /100 | #316 | Tragic 80.6% |
| Immigrants | Caribbean | 0.0 /100 | #317 | Tragic 80.5% |
| Yaqui | 0.0 /100 | #318 | Tragic 80.5% |
| Immigrants | Belize | 0.0 /100 | #319 | Tragic 80.5% |
Demographics Similar to Austrians by GED/Equivalency
In terms of ged/equivalency, the demographic groups most similar to Austrians are Ukrainian (87.7%, a difference of 0.0%), Immigrants from Moldova (87.7%, a difference of 0.0%), Belgian (87.7%, a difference of 0.010%), Immigrants from Kuwait (87.7%, a difference of 0.030%), and Immigrants from Saudi Arabia (87.8%, a difference of 0.050%).
| Demographics | Rating | Rank | GED/Equivalency |
| Immigrants | Canada | 99.2 /100 | #64 | Exceptional 87.9% |
| Immigrants | North America | 99.1 /100 | #65 | Exceptional 87.8% |
| Immigrants | Bulgaria | 99.1 /100 | #66 | Exceptional 87.8% |
| British | 99.1 /100 | #67 | Exceptional 87.8% |
| Immigrants | France | 99.1 /100 | #68 | Exceptional 87.8% |
| Immigrants | Saudi Arabia | 99.0 /100 | #69 | Exceptional 87.8% |
| Ukrainians | 98.8 /100 | #70 | Exceptional 87.7% |
| Austrians | 98.8 /100 | #71 | Exceptional 87.7% |
| Immigrants | Moldova | 98.8 /100 | #72 | Exceptional 87.7% |
| Belgians | 98.8 /100 | #73 | Exceptional 87.7% |
| Immigrants | Kuwait | 98.8 /100 | #74 | Exceptional 87.7% |
| Scottish | 98.7 /100 | #75 | Exceptional 87.7% |
| Immigrants | Serbia | 98.7 /100 | #76 | Exceptional 87.7% |
| Slavs | 98.7 /100 | #77 | Exceptional 87.7% |
| Irish | 98.6 /100 | #78 | Exceptional 87.6% |