Israeli vs Bahamian GED/Equivalency
COMPARE
Israeli
Bahamian
GED/Equivalency
GED/Equivalency Comparison
Israelis
Bahamians
87.4%
GED/EQUIVALENCY
97.8/ 100
METRIC RATING
92nd/ 347
METRIC RANK
83.6%
GED/EQUIVALENCY
0.8/ 100
METRIC RATING
252nd/ 347
METRIC RANK
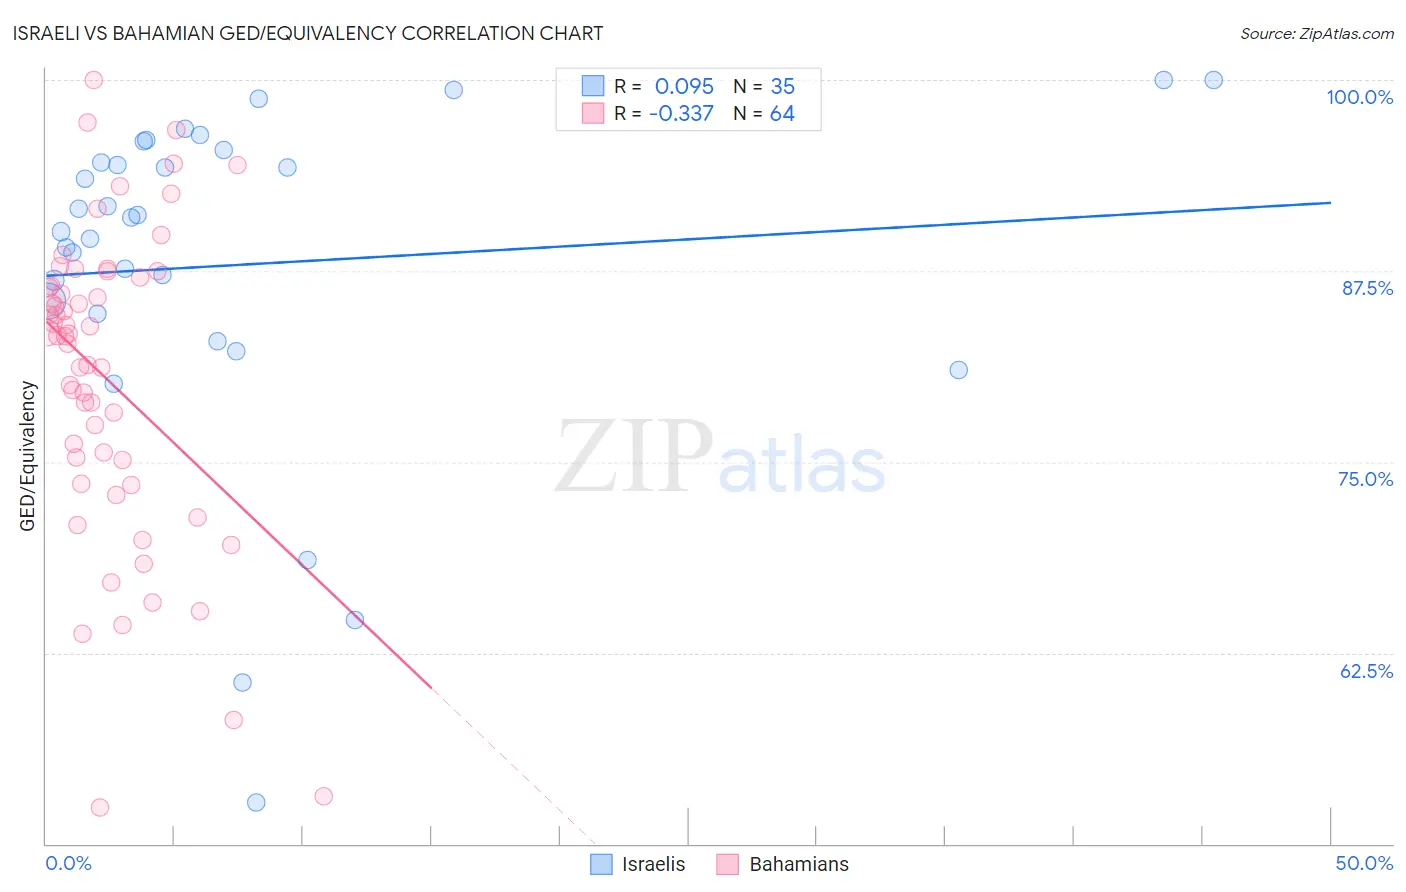
Israeli vs Bahamian GED/Equivalency Correlation Chart
The statistical analysis conducted on geographies consisting of 211,219,980 people shows a slight positive correlation between the proportion of Israelis and percentage of population with at least ged/equivalency education in the United States with a correlation coefficient (R) of 0.095 and weighted average of 87.4%. Similarly, the statistical analysis conducted on geographies consisting of 112,707,159 people shows a mild negative correlation between the proportion of Bahamians and percentage of population with at least ged/equivalency education in the United States with a correlation coefficient (R) of -0.337 and weighted average of 83.6%, a difference of 4.5%.
GED/Equivalency Correlation Summary
| Measurement | Israeli | Bahamian |
| Minimum | 52.7% | 52.4% |
| Maximum | 100.0% | 100.0% |
| Range | 47.3% | 47.6% |
| Mean | 87.9% | 80.4% |
| Median | 91.0% | 83.2% |
| Interquartile 25% (IQ1) | 84.7% | 74.4% |
| Interquartile 75% (IQ3) | 95.4% | 86.8% |
| Interquartile Range (IQR) | 10.7% | 12.5% |
| Standard Deviation (Sample) | 11.1% | 10.2% |
| Standard Deviation (Population) | 11.0% | 10.1% |
Similar Demographics by GED/Equivalency
Demographics Similar to Israelis by GED/Equivalency
In terms of ged/equivalency, the demographic groups most similar to Israelis are Immigrants from Eastern Asia (87.4%, a difference of 0.010%), Immigrants from North Macedonia (87.4%, a difference of 0.010%), Immigrants from Russia (87.4%, a difference of 0.010%), Hungarian (87.4%, a difference of 0.020%), and Welsh (87.4%, a difference of 0.020%).
| Demographics | Rating | Rank | GED/Equivalency |
| Dutch | 98.1 /100 | #85 | Exceptional 87.5% |
| Immigrants | Europe | 98.1 /100 | #86 | Exceptional 87.5% |
| Native Hawaiians | 98.1 /100 | #87 | Exceptional 87.5% |
| Immigrants | Norway | 98.1 /100 | #88 | Exceptional 87.5% |
| Hungarians | 97.9 /100 | #89 | Exceptional 87.4% |
| Welsh | 97.9 /100 | #90 | Exceptional 87.4% |
| Immigrants | Eastern Asia | 97.9 /100 | #91 | Exceptional 87.4% |
| Israelis | 97.8 /100 | #92 | Exceptional 87.4% |
| Immigrants | North Macedonia | 97.8 /100 | #93 | Exceptional 87.4% |
| Immigrants | Russia | 97.8 /100 | #94 | Exceptional 87.4% |
| Immigrants | Greece | 97.7 /100 | #95 | Exceptional 87.4% |
| Czechoslovakians | 97.6 /100 | #96 | Exceptional 87.4% |
| Immigrants | Western Europe | 97.3 /100 | #97 | Exceptional 87.3% |
| Immigrants | Croatia | 96.9 /100 | #98 | Exceptional 87.3% |
| Immigrants | Belarus | 96.9 /100 | #99 | Exceptional 87.3% |
Demographics Similar to Bahamians by GED/Equivalency
In terms of ged/equivalency, the demographic groups most similar to Bahamians are Spanish American (83.6%, a difference of 0.0%), Comanche (83.6%, a difference of 0.060%), Creek (83.6%, a difference of 0.090%), Shoshone (83.7%, a difference of 0.15%), and Blackfeet (83.8%, a difference of 0.17%).
| Demographics | Rating | Rank | GED/Equivalency |
| Immigrants | Senegal | 1.2 /100 | #245 | Tragic 83.8% |
| Chickasaw | 1.2 /100 | #246 | Tragic 83.8% |
| Immigrants | Western Africa | 1.1 /100 | #247 | Tragic 83.8% |
| Blackfeet | 1.1 /100 | #248 | Tragic 83.8% |
| Crow | 1.1 /100 | #249 | Tragic 83.8% |
| Shoshone | 1.0 /100 | #250 | Tragic 83.7% |
| Spanish Americans | 0.8 /100 | #251 | Tragic 83.6% |
| Bahamians | 0.8 /100 | #252 | Tragic 83.6% |
| Comanche | 0.7 /100 | #253 | Tragic 83.6% |
| Creek | 0.7 /100 | #254 | Tragic 83.6% |
| Colville | 0.5 /100 | #255 | Tragic 83.4% |
| Africans | 0.5 /100 | #256 | Tragic 83.4% |
| Jamaicans | 0.4 /100 | #257 | Tragic 83.3% |
| Malaysians | 0.4 /100 | #258 | Tragic 83.3% |
| Immigrants | Vietnam | 0.3 /100 | #259 | Tragic 83.2% |