Israeli Receiving Food Stamps
COMPARE
Israeli
Select to Compare
Receiving Food Stamps
Israeli Receiving Food Stamps
10.7%
PUBLIC INCOME | FOOD STAMPS
92.4/ 100
METRIC RATING
130th/ 347
METRIC RANK
Israeli Receiving Food Stamps Correlation Chart
The statistical analysis conducted on geographies consisting of 210,490,548 people shows a substantial negative correlation between the proportion of Israelis and percentage of population receiving government assistance and/or food stamps in the United States with a correlation coefficient (R) of -0.540 and weighted average of 10.7%. On average, for every 1% (one percent) increase in Israelis within a typical geography, there is a decrease of 0.92% in percentage of population receiving government assistance and/or food stamps.
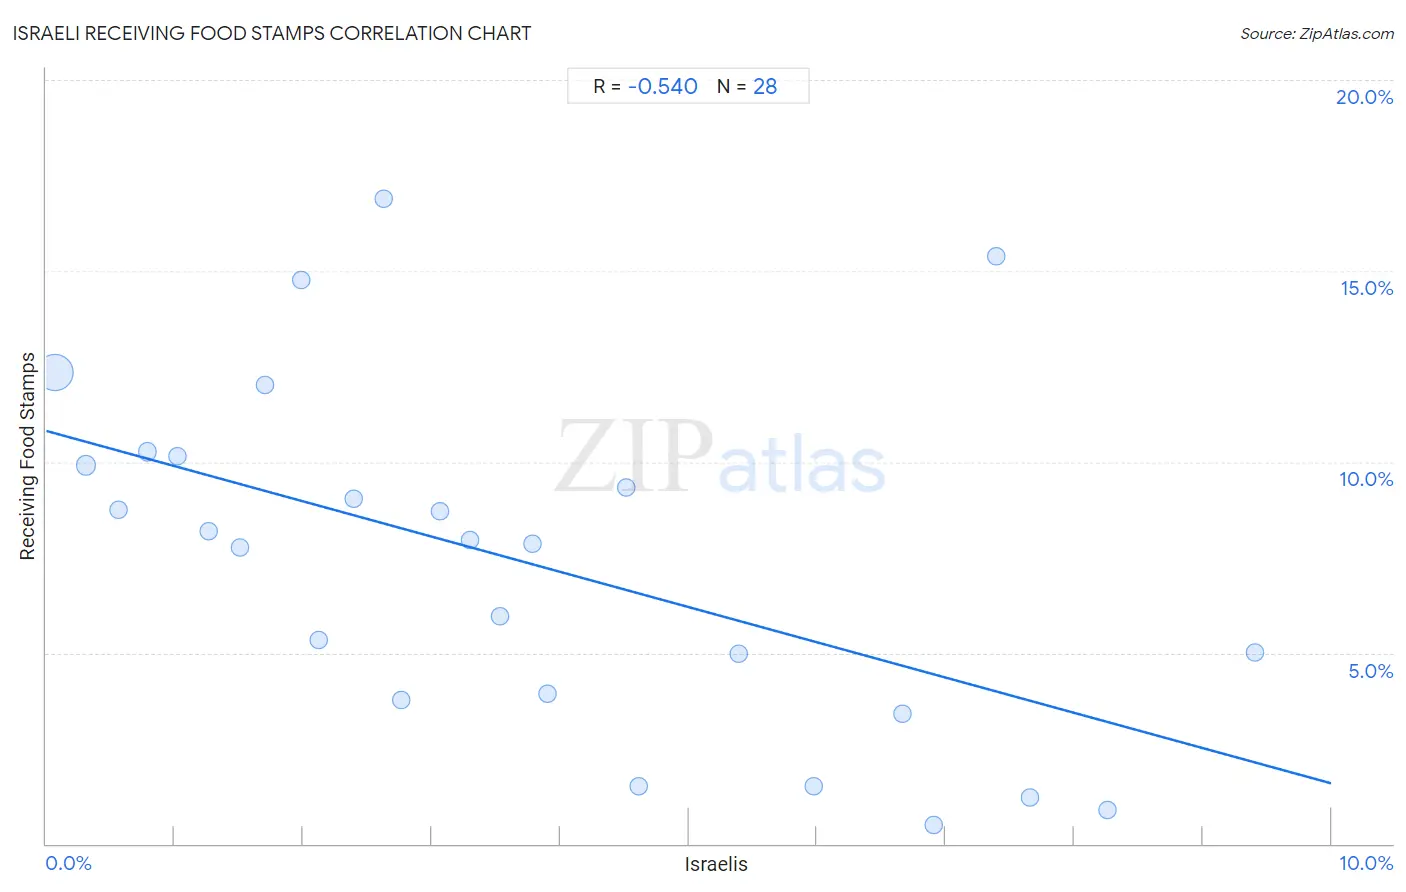
It is essential to understand that the correlation between the percentage of Israelis and percentage of population receiving government assistance and/or food stamps does not imply a direct cause-and-effect relationship. It remains uncertain whether the presence of Israelis influences an upward or downward trend in the level of percentage of population receiving government assistance and/or food stamps within an area, or if Israelis simply ended up residing in those areas with higher or lower levels of percentage of population receiving government assistance and/or food stamps due to other factors.
Demographics Similar to Israelis by Receiving Food Stamps
In terms of receiving food stamps, the demographic groups most similar to Israelis are French (10.7%, a difference of 0.0%), Immigrants from Jordan (10.7%, a difference of 0.10%), Yugoslavian (10.7%, a difference of 0.10%), Immigrants from Ethiopia (10.7%, a difference of 0.11%), and Afghan (10.7%, a difference of 0.13%).
| Demographics | Rating | Rank | Receiving Food Stamps |
| Immigrants from Philippines | 93.3 /100 | #123 | Exceptional 10.7% |
| Paraguayans | 93.0 /100 | #124 | Exceptional 10.7% |
| Ukrainians | 92.8 /100 | #125 | Exceptional 10.7% |
| Afghans | 92.6 /100 | #126 | Exceptional 10.7% |
| Immigrants from Ethiopia | 92.6 /100 | #127 | Exceptional 10.7% |
| Immigrants from Jordan | 92.5 /100 | #128 | Exceptional 10.7% |
| Yugoslavians | 92.5 /100 | #129 | Exceptional 10.7% |
| Israelis | 92.4 /100 | #130 | Exceptional 10.7% |
| French | 92.3 /100 | #131 | Exceptional 10.7% |
| Immigrants from Germany | 92.0 /100 | #132 | Exceptional 10.7% |
| Immigrants from Russia | 90.9 /100 | #133 | Exceptional 10.8% |
| Immigrants from Brazil | 90.3 /100 | #134 | Exceptional 10.8% |
| Argentineans | 90.2 /100 | #135 | Exceptional 10.8% |
| Slovaks | 89.8 /100 | #136 | Excellent 10.8% |
| Immigrants from Eastern Europe | 89.8 /100 | #137 | Excellent 10.8% |
Israeli Receiving Food Stamps Correlation Summary
| Measurement | Israeli Data | Receiving Food Stamps Data |
| Minimum | 0.066% | 0.50% |
| Maximum | 9.4% | 16.9% |
| Range | 9.3% | 16.4% |
| Mean | 3.7% | 7.4% |
| Median | 3.2% | 7.9% |
| Interquartile 25% (IQ1) | 1.6% | 3.9% |
| Interquartile 75% (IQ3) | 5.7% | 10.0% |
| Interquartile Range (IQR) | 4.1% | 6.2% |
| Standard Deviation (Sample) | 2.6% | 4.5% |
| Standard Deviation (Population) | 2.6% | 4.4% |
Correlation Details
| Israeli Percentile | Sample Size | Receiving Food Stamps |
[ 0.0% - 0.5% ] 0.066% | 182,437,689 | 12.3% |
[ 0.0% - 0.5% ] 0.31% | 18,242,045 | 9.9% |
[ 0.5% - 1.0% ] 0.57% | 4,244,844 | 8.8% |
[ 0.5% - 1.0% ] 0.78% | 1,986,608 | 10.3% |
[ 1.0% - 1.5% ] 1.02% | 1,353,316 | 10.2% |
[ 1.0% - 1.5% ] 1.26% | 606,218 | 8.2% |
[ 1.5% - 2.0% ] 1.51% | 215,799 | 7.8% |
[ 1.5% - 2.0% ] 1.70% | 376,622 | 12.0% |
[ 1.5% - 2.0% ] 1.99% | 235,644 | 14.8% |
[ 2.0% - 2.5% ] 2.12% | 236,629 | 5.3% |
[ 2.0% - 2.5% ] 2.40% | 130,559 | 9.0% |
[ 2.5% - 3.0% ] 2.63% | 66,201 | 16.9% |
[ 2.5% - 3.0% ] 2.76% | 56,065 | 3.8% |
[ 3.0% - 3.5% ] 3.06% | 68,936 | 8.7% |
[ 3.0% - 3.5% ] 3.30% | 69,628 | 8.0% |
[ 3.5% - 4.0% ] 3.53% | 71,502 | 6.0% |
[ 3.5% - 4.0% ] 3.79% | 32,830 | 7.9% |
[ 3.5% - 4.0% ] 3.90% | 5,617 | 3.9% |
[ 4.5% - 5.0% ] 4.52% | 598 | 9.3% |
[ 4.5% - 5.0% ] 4.61% | 18,210 | 1.5% |
[ 5.0% - 5.5% ] 5.39% | 5,564 | 5.0% |
[ 5.5% - 6.0% ] 5.98% | 8,851 | 1.5% |
[ 6.5% - 7.0% ] 6.66% | 4,550 | 3.4% |
[ 6.5% - 7.0% ] 6.91% | 7,307 | 0.50% |
[ 7.0% - 7.5% ] 7.39% | 717 | 15.4% |
[ 7.5% - 8.0% ] 7.65% | 810 | 1.2% |
[ 8.0% - 8.5% ] 8.26% | 1,066 | 0.90% |
[ 9.0% - 9.5% ] 9.41% | 6,123 | 5.0% |