Immigrants from Taiwan vs Immigrants from Netherlands GED/Equivalency
COMPARE
Immigrants from Taiwan
Immigrants from Netherlands
GED/Equivalency
GED/Equivalency Comparison
Immigrants from Taiwan
Immigrants from Netherlands
88.8%
GED/EQUIVALENCY
99.9/ 100
METRIC RATING
16th/ 347
METRIC RANK
88.0%
GED/EQUIVALENCY
99.4/ 100
METRIC RATING
51st/ 347
METRIC RANK
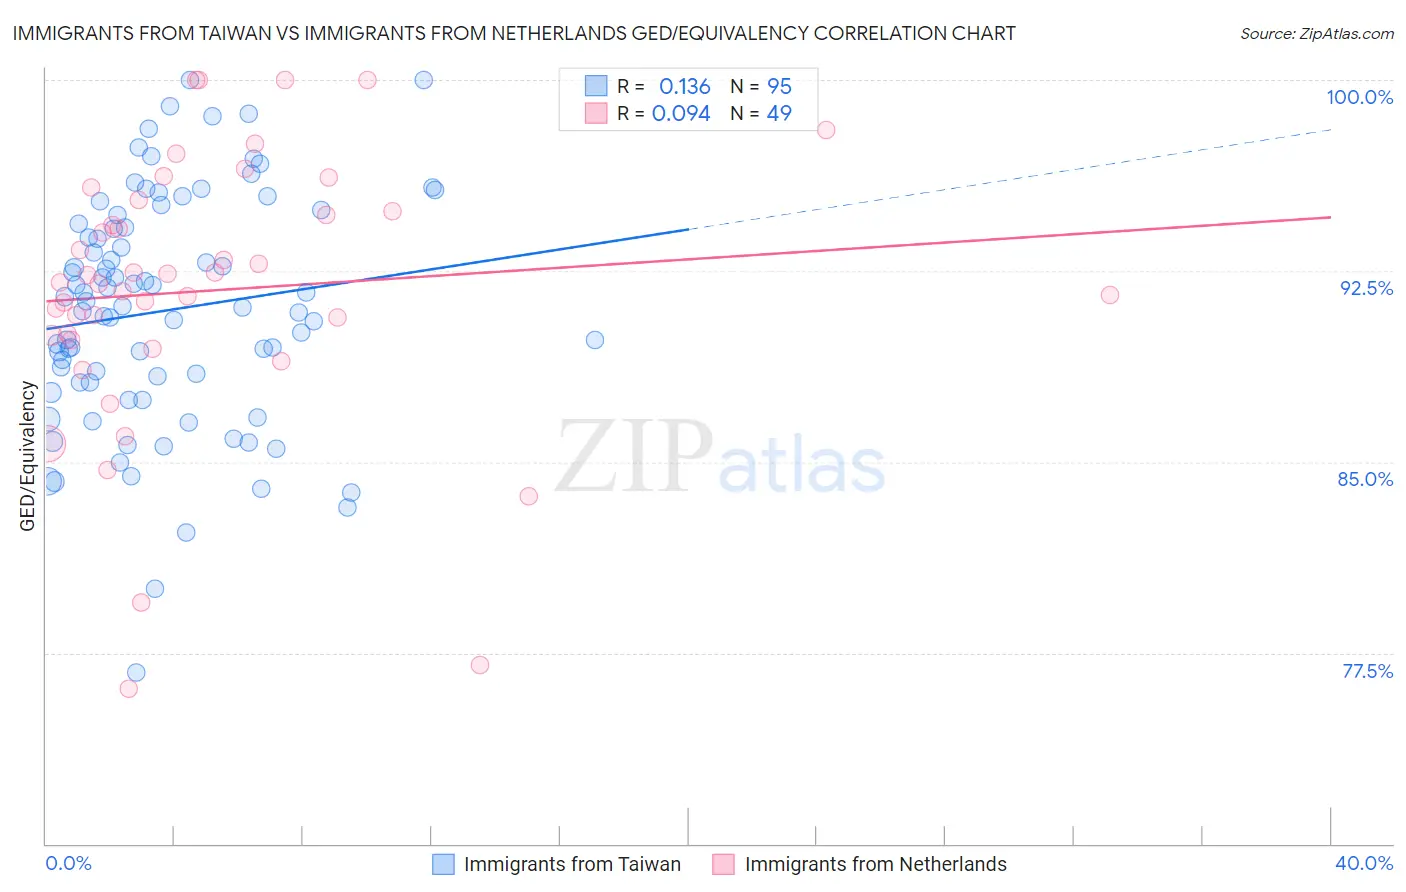
Immigrants from Taiwan vs Immigrants from Netherlands GED/Equivalency Correlation Chart
The statistical analysis conducted on geographies consisting of 298,292,402 people shows a poor positive correlation between the proportion of Immigrants from Taiwan and percentage of population with at least ged/equivalency education in the United States with a correlation coefficient (R) of 0.136 and weighted average of 88.8%. Similarly, the statistical analysis conducted on geographies consisting of 237,874,463 people shows a slight positive correlation between the proportion of Immigrants from Netherlands and percentage of population with at least ged/equivalency education in the United States with a correlation coefficient (R) of 0.094 and weighted average of 88.0%, a difference of 0.95%.
GED/Equivalency Correlation Summary
| Measurement | Immigrants from Taiwan | Immigrants from Netherlands |
| Minimum | 76.7% | 76.1% |
| Maximum | 100.0% | 100.0% |
| Range | 23.3% | 23.9% |
| Mean | 91.0% | 91.7% |
| Median | 91.1% | 92.1% |
| Interquartile 25% (IQ1) | 88.1% | 89.9% |
| Interquartile 75% (IQ3) | 94.4% | 95.1% |
| Interquartile Range (IQR) | 6.2% | 5.2% |
| Standard Deviation (Sample) | 4.6% | 5.3% |
| Standard Deviation (Population) | 4.5% | 5.3% |
Similar Demographics by GED/Equivalency
Demographics Similar to Immigrants from Taiwan by GED/Equivalency
In terms of ged/equivalency, the demographic groups most similar to Immigrants from Taiwan are Okinawan (88.9%, a difference of 0.030%), Croatian (88.8%, a difference of 0.030%), Cypriot (88.9%, a difference of 0.050%), Slovene (88.8%, a difference of 0.060%), and Immigrants from Iran (88.9%, a difference of 0.080%).
| Demographics | Rating | Rank | GED/Equivalency |
| Chinese | 99.9 /100 | #9 | Exceptional 89.0% |
| Norwegians | 99.9 /100 | #10 | Exceptional 89.0% |
| Bulgarians | 99.9 /100 | #11 | Exceptional 89.0% |
| Lithuanians | 99.9 /100 | #12 | Exceptional 88.9% |
| Immigrants | Iran | 99.9 /100 | #13 | Exceptional 88.9% |
| Cypriots | 99.9 /100 | #14 | Exceptional 88.9% |
| Okinawans | 99.9 /100 | #15 | Exceptional 88.9% |
| Immigrants | Taiwan | 99.9 /100 | #16 | Exceptional 88.8% |
| Croatians | 99.9 /100 | #17 | Exceptional 88.8% |
| Slovenes | 99.9 /100 | #18 | Exceptional 88.8% |
| Swedes | 99.9 /100 | #19 | Exceptional 88.8% |
| Maltese | 99.9 /100 | #20 | Exceptional 88.6% |
| Luxembourgers | 99.8 /100 | #21 | Exceptional 88.6% |
| Immigrants | Ireland | 99.8 /100 | #22 | Exceptional 88.6% |
| Russians | 99.8 /100 | #23 | Exceptional 88.6% |
Demographics Similar to Immigrants from Netherlands by GED/Equivalency
In terms of ged/equivalency, the demographic groups most similar to Immigrants from Netherlands are Zimbabwean (88.0%, a difference of 0.0%), Immigrants from South Africa (88.0%, a difference of 0.0%), Soviet Union (88.0%, a difference of 0.010%), New Zealander (88.0%, a difference of 0.020%), and Immigrants from Denmark (88.0%, a difference of 0.030%).
| Demographics | Rating | Rank | GED/Equivalency |
| Macedonians | 99.5 /100 | #44 | Exceptional 88.1% |
| Czechs | 99.5 /100 | #45 | Exceptional 88.1% |
| Immigrants | Switzerland | 99.5 /100 | #46 | Exceptional 88.1% |
| Immigrants | Latvia | 99.5 /100 | #47 | Exceptional 88.1% |
| Greeks | 99.5 /100 | #48 | Exceptional 88.1% |
| Australians | 99.5 /100 | #49 | Exceptional 88.1% |
| Immigrants | Korea | 99.5 /100 | #50 | Exceptional 88.1% |
| Immigrants | Netherlands | 99.4 /100 | #51 | Exceptional 88.0% |
| Zimbabweans | 99.4 /100 | #52 | Exceptional 88.0% |
| Immigrants | South Africa | 99.4 /100 | #53 | Exceptional 88.0% |
| Soviet Union | 99.4 /100 | #54 | Exceptional 88.0% |
| New Zealanders | 99.4 /100 | #55 | Exceptional 88.0% |
| Immigrants | Denmark | 99.4 /100 | #56 | Exceptional 88.0% |
| Immigrants | Czechoslovakia | 99.3 /100 | #57 | Exceptional 87.9% |
| Northern Europeans | 99.3 /100 | #58 | Exceptional 87.9% |