Immigrants from Argentina vs Immigrants from Grenada GED/Equivalency
COMPARE
Immigrants from Argentina
Immigrants from Grenada
GED/Equivalency
GED/Equivalency Comparison
Immigrants from Argentina
Immigrants from Grenada
86.6%
GED/EQUIVALENCY
86.5/ 100
METRIC RATING
138th/ 347
METRIC RANK
81.3%
GED/EQUIVALENCY
0.0/ 100
METRIC RATING
305th/ 347
METRIC RANK
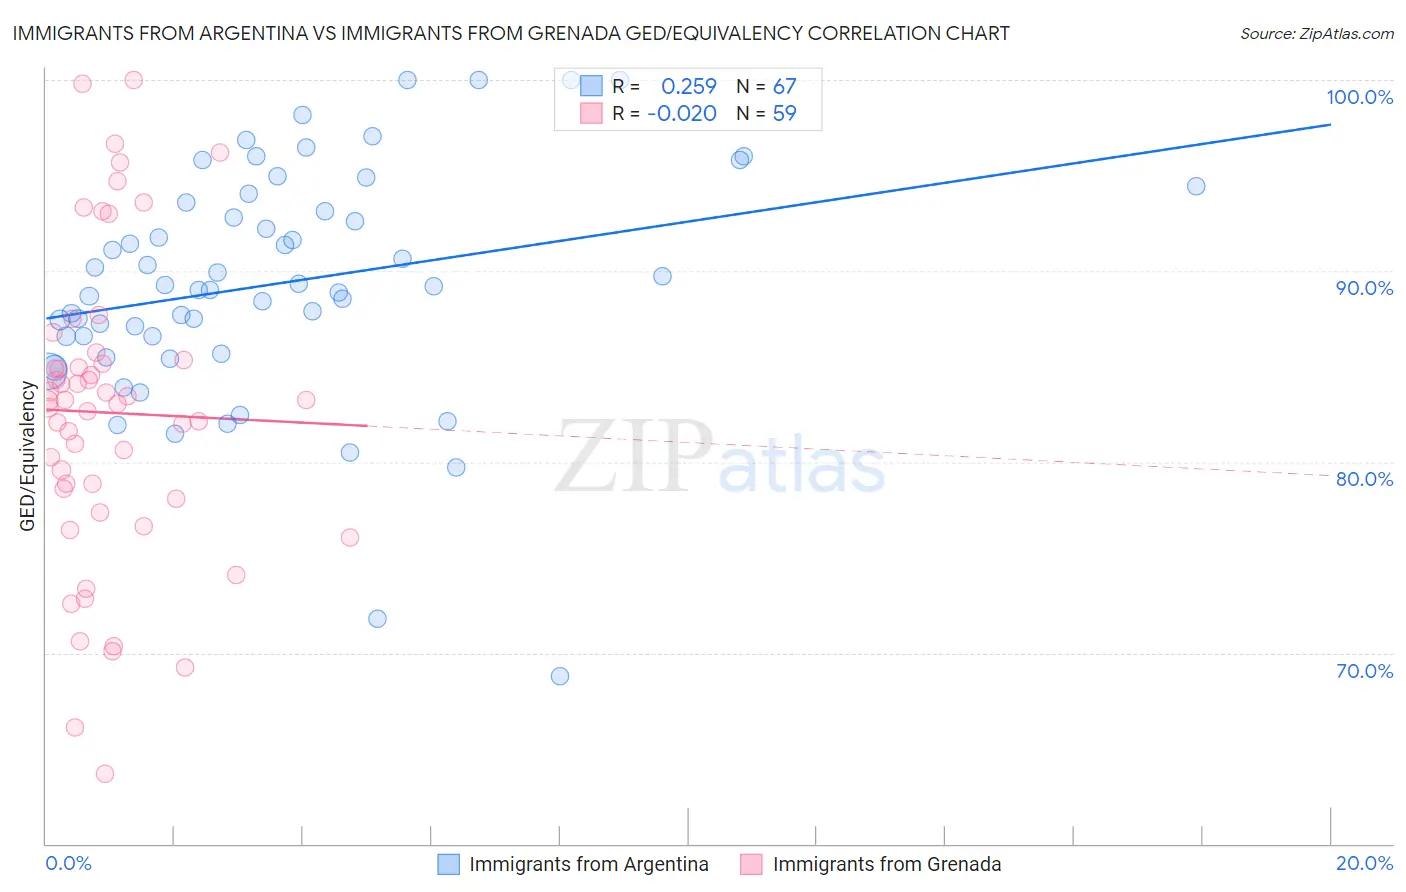
Immigrants from Argentina vs Immigrants from Grenada GED/Equivalency Correlation Chart
The statistical analysis conducted on geographies consisting of 264,434,241 people shows a weak positive correlation between the proportion of Immigrants from Argentina and percentage of population with at least ged/equivalency education in the United States with a correlation coefficient (R) of 0.259 and weighted average of 86.6%. Similarly, the statistical analysis conducted on geographies consisting of 67,201,908 people shows no correlation between the proportion of Immigrants from Grenada and percentage of population with at least ged/equivalency education in the United States with a correlation coefficient (R) of -0.020 and weighted average of 81.3%, a difference of 6.5%.
GED/Equivalency Correlation Summary
| Measurement | Immigrants from Argentina | Immigrants from Grenada |
| Minimum | 68.8% | 63.6% |
| Maximum | 100.0% | 100.0% |
| Range | 31.2% | 36.4% |
| Mean | 89.4% | 82.6% |
| Median | 89.2% | 83.2% |
| Interquartile 25% (IQ1) | 86.6% | 78.1% |
| Interquartile 75% (IQ3) | 93.6% | 85.3% |
| Interquartile Range (IQR) | 7.0% | 7.2% |
| Standard Deviation (Sample) | 6.1% | 8.0% |
| Standard Deviation (Population) | 6.0% | 7.9% |
Similar Demographics by GED/Equivalency
Demographics Similar to Immigrants from Argentina by GED/Equivalency
In terms of ged/equivalency, the demographic groups most similar to Immigrants from Argentina are Arab (86.6%, a difference of 0.010%), Chilean (86.6%, a difference of 0.020%), Immigrants from Asia (86.6%, a difference of 0.040%), Albanian (86.6%, a difference of 0.050%), and Immigrants from Malaysia (86.5%, a difference of 0.060%).
| Demographics | Rating | Rank | GED/Equivalency |
| Immigrants | Spain | 88.5 /100 | #131 | Excellent 86.7% |
| Immigrants | Brazil | 88.4 /100 | #132 | Excellent 86.6% |
| Tsimshian | 88.3 /100 | #133 | Excellent 86.6% |
| Albanians | 87.7 /100 | #134 | Excellent 86.6% |
| Immigrants | Asia | 87.4 /100 | #135 | Excellent 86.6% |
| Chileans | 86.9 /100 | #136 | Excellent 86.6% |
| Arabs | 86.7 /100 | #137 | Excellent 86.6% |
| Immigrants | Argentina | 86.5 /100 | #138 | Excellent 86.6% |
| Immigrants | Malaysia | 85.0 /100 | #139 | Excellent 86.5% |
| Paraguayans | 84.1 /100 | #140 | Excellent 86.5% |
| Laotians | 83.2 /100 | #141 | Excellent 86.5% |
| Immigrants | Indonesia | 82.4 /100 | #142 | Excellent 86.4% |
| Immigrants | Pakistan | 82.4 /100 | #143 | Excellent 86.4% |
| Bolivians | 82.1 /100 | #144 | Excellent 86.4% |
| Pakistanis | 80.4 /100 | #145 | Excellent 86.4% |
Demographics Similar to Immigrants from Grenada by GED/Equivalency
In terms of ged/equivalency, the demographic groups most similar to Immigrants from Grenada are Guyanese (81.3%, a difference of 0.020%), Immigrants from Dominica (81.1%, a difference of 0.19%), Navajo (81.5%, a difference of 0.21%), Puerto Rican (81.1%, a difference of 0.30%), and Immigrants from Haiti (81.6%, a difference of 0.31%).
| Demographics | Rating | Rank | GED/Equivalency |
| Ute | 0.0 /100 | #298 | Tragic 81.8% |
| Ecuadorians | 0.0 /100 | #299 | Tragic 81.7% |
| Fijians | 0.0 /100 | #300 | Tragic 81.6% |
| Dutch West Indians | 0.0 /100 | #301 | Tragic 81.6% |
| Immigrants | Haiti | 0.0 /100 | #302 | Tragic 81.6% |
| Immigrants | Portugal | 0.0 /100 | #303 | Tragic 81.6% |
| Navajo | 0.0 /100 | #304 | Tragic 81.5% |
| Immigrants | Grenada | 0.0 /100 | #305 | Tragic 81.3% |
| Guyanese | 0.0 /100 | #306 | Tragic 81.3% |
| Immigrants | Dominica | 0.0 /100 | #307 | Tragic 81.1% |
| Puerto Ricans | 0.0 /100 | #308 | Tragic 81.1% |
| Immigrants | Ecuador | 0.0 /100 | #309 | Tragic 81.0% |
| Immigrants | Guyana | 0.0 /100 | #310 | Tragic 81.0% |
| Natives/Alaskans | 0.0 /100 | #311 | Tragic 80.9% |
| Nicaraguans | 0.0 /100 | #312 | Tragic 80.9% |