Immigrants from Afghanistan Disability Age Under 5
COMPARE
Immigrants from Afghanistan
Select to Compare
Disability Age Under 5
Immigrants from Afghanistan Disability Age Under 5
0.91%
DISABILITY | AGE UNDER 5
100.0/ 100
METRIC RATING
7th/ 347
METRIC RANK
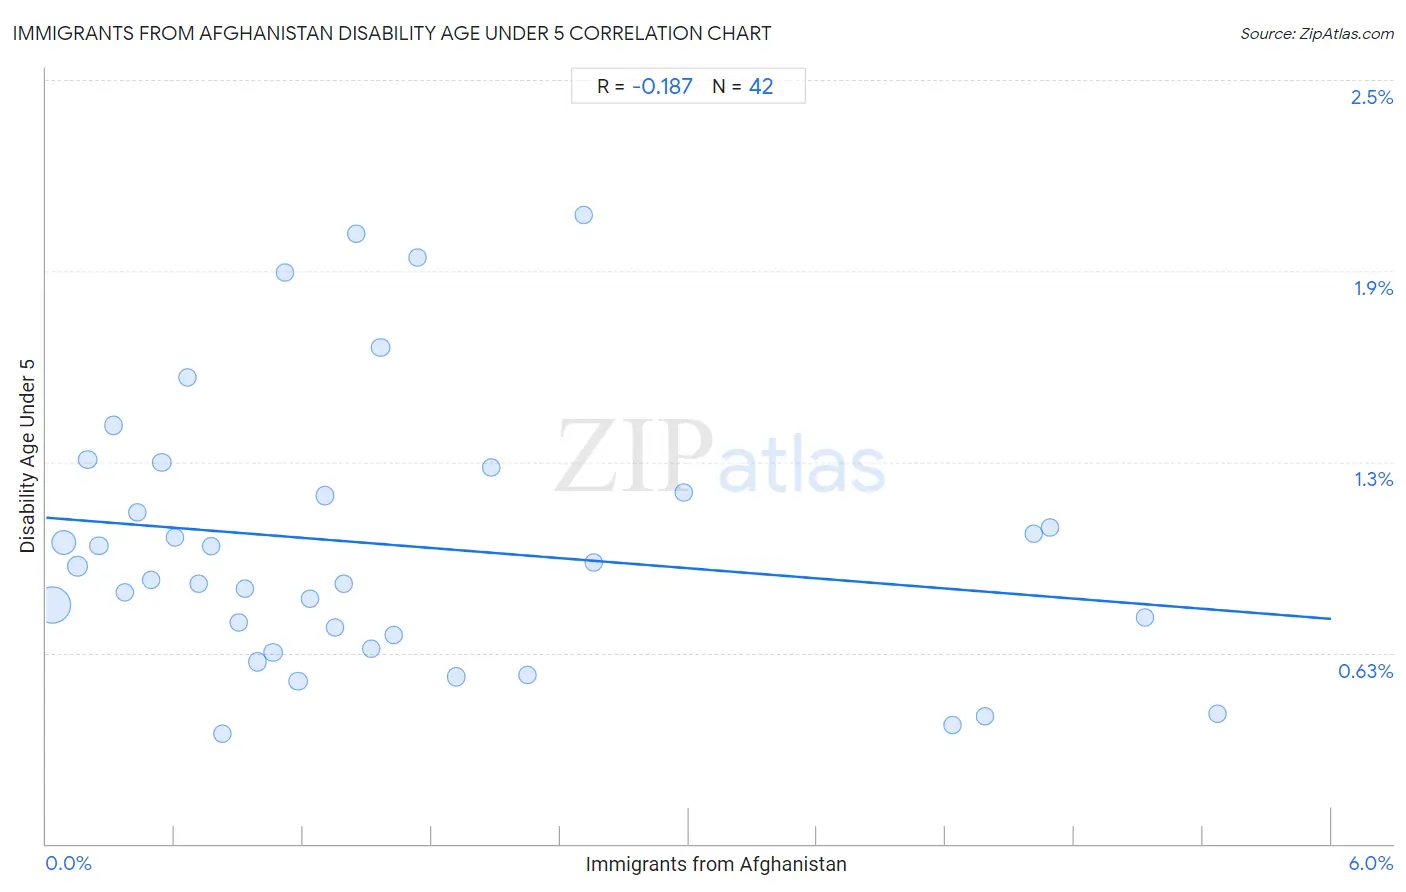
Immigrants from Afghanistan Disability Age Under 5 Correlation Chart
The statistical analysis conducted on geographies consisting of 107,593,919 people shows a poor negative correlation between the proportion of Immigrants from Afghanistan and percentage of population with a disability under the age of 5 in the United States with a correlation coefficient (R) of -0.187 and weighted average of 0.91%. On average, for every 1% (one percent) increase in Immigrants from Afghanistan within a typical geography, there is a decrease of 0.055% in percentage of population with a disability under the age of 5.
It is essential to understand that the correlation between the percentage of Immigrants from Afghanistan and percentage of population with a disability under the age of 5 does not imply a direct cause-and-effect relationship. It remains uncertain whether the presence of Immigrants from Afghanistan influences an upward or downward trend in the level of percentage of population with a disability under the age of 5 within an area, or if Immigrants from Afghanistan simply ended up residing in those areas with higher or lower levels of percentage of population with a disability under the age of 5 due to other factors.
Demographics Similar to Immigrants from Afghanistan by Disability Age Under 5
In terms of disability age under 5, the demographic groups most similar to Immigrants from Afghanistan are Immigrants from Yemen (0.91%, a difference of 0.13%), Immigrants from Fiji (0.92%, a difference of 1.2%), Marshallese (0.94%, a difference of 3.4%), Afghan (0.94%, a difference of 4.1%), and Immigrants from Grenada (0.94%, a difference of 4.2%).
| Demographics | Rating | Rank | Disability Age Under 5 |
| Immigrants from Armenia | 100.0 /100 | #1 | Exceptional 0.76% |
| Immigrants from St. Vincent and the Grenadines | 100.0 /100 | #2 | Exceptional 0.79% |
| Vietnamese | 100.0 /100 | #3 | Exceptional 0.81% |
| Immigrants from Uzbekistan | 100.0 /100 | #4 | Exceptional 0.85% |
| Immigrants from Bangladesh | 100.0 /100 | #5 | Exceptional 0.85% |
| Ute | 100.0 /100 | #6 | Exceptional 0.86% |
| Immigrants from Afghanistan | 100.0 /100 | #7 | Exceptional 0.91% |
| Immigrants from Yemen | 100.0 /100 | #8 | Exceptional 0.91% |
| Immigrants from Fiji | 100.0 /100 | #9 | Exceptional 0.92% |
| Marshallese | 100.0 /100 | #10 | Exceptional 0.94% |
| Afghans | 100.0 /100 | #11 | Exceptional 0.94% |
| Immigrants from Grenada | 100.0 /100 | #12 | Exceptional 0.94% |
| Soviet Union | 100.0 /100 | #13 | Exceptional 0.95% |
| Yuman | 100.0 /100 | #14 | Exceptional 0.95% |
| Immigrants from Hong Kong | 100.0 /100 | #15 | Exceptional 0.95% |
Immigrants from Afghanistan Disability Age Under 5 Correlation Summary
| Measurement | Immigrants from Afghanistan Data | Disability Age Under 5 Data |
| Minimum | 0.029% | 0.36% |
| Maximum | 5.5% | 2.1% |
| Range | 5.4% | 1.7% |
| Mean | 1.6% | 0.98% |
| Median | 1.2% | 0.88% |
| Interquartile 25% (IQ1) | 0.60% | 0.68% |
| Interquartile 75% (IQ3) | 2.1% | 1.2% |
| Interquartile Range (IQR) | 1.5% | 0.47% |
| Standard Deviation (Sample) | 1.5% | 0.44% |
| Standard Deviation (Population) | 1.5% | 0.43% |
Correlation Details
| Immigrants from Afghanistan Percentile | Sample Size | Disability Age Under 5 |
[ 0.0% - 0.5% ] 0.029% | 61,989,718 | 0.78% |
[ 0.0% - 0.5% ] 0.083% | 20,701,112 | 0.98% |
[ 0.0% - 0.5% ] 0.14% | 8,111,562 | 0.91% |
[ 0.0% - 0.5% ] 0.19% | 2,948,902 | 1.3% |
[ 0.0% - 0.5% ] 0.25% | 3,237,212 | 0.98% |
[ 0.0% - 0.5% ] 0.32% | 1,601,612 | 1.4% |
[ 0.0% - 0.5% ] 0.37% | 1,053,004 | 0.82% |
[ 0.0% - 0.5% ] 0.43% | 996,794 | 1.1% |
[ 0.0% - 0.5% ] 0.49% | 837,318 | 0.86% |
[ 0.5% - 1.0% ] 0.54% | 559,854 | 1.2% |
[ 0.5% - 1.0% ] 0.60% | 250,108 | 1.0% |
[ 0.5% - 1.0% ] 0.66% | 266,793 | 1.5% |
[ 0.5% - 1.0% ] 0.71% | 383,159 | 0.85% |
[ 0.5% - 1.0% ] 0.77% | 586,505 | 0.98% |
[ 0.5% - 1.0% ] 0.82% | 530,661 | 0.36% |
[ 0.5% - 1.0% ] 0.90% | 89,534 | 0.72% |
[ 0.5% - 1.0% ] 0.93% | 436,066 | 0.83% |
[ 0.5% - 1.0% ] 0.99% | 383,077 | 0.60% |
[ 1.0% - 1.5% ] 1.06% | 363,458 | 0.63% |
[ 1.0% - 1.5% ] 1.11% | 99,112 | 1.9% |
[ 1.0% - 1.5% ] 1.18% | 310,210 | 0.53% |
[ 1.0% - 1.5% ] 1.23% | 131,893 | 0.80% |
[ 1.0% - 1.5% ] 1.30% | 227,881 | 1.1% |
[ 1.0% - 1.5% ] 1.35% | 94,332 | 0.71% |
[ 1.0% - 1.5% ] 1.39% | 125,990 | 0.85% |
[ 1.0% - 1.5% ] 1.45% | 90,624 | 2.0% |
[ 1.5% - 2.0% ] 1.52% | 162,757 | 0.64% |
[ 1.5% - 2.0% ] 1.56% | 130,726 | 1.6% |
[ 1.5% - 2.0% ] 1.62% | 121,184 | 0.68% |
[ 1.5% - 2.0% ] 1.73% | 44,115 | 1.9% |
[ 1.5% - 2.0% ] 1.91% | 161,077 | 0.55% |
[ 2.0% - 2.5% ] 2.08% | 127,855 | 1.2% |
[ 2.0% - 2.5% ] 2.25% | 88,295 | 0.55% |
[ 2.5% - 3.0% ] 2.51% | 21,542 | 2.1% |
[ 2.5% - 3.0% ] 2.55% | 63,715 | 0.92% |
[ 2.5% - 3.0% ] 2.97% | 19,531 | 1.2% |
[ 4.0% - 4.5% ] 4.23% | 37,635 | 0.39% |
[ 4.0% - 4.5% ] 4.38% | 34,775 | 0.42% |
[ 4.5% - 5.0% ] 4.61% | 16,050 | 1.0% |
[ 4.5% - 5.0% ] 4.69% | 37,310 | 1.0% |
[ 5.0% - 5.5% ] 5.13% | 24,785 | 0.74% |
[ 5.0% - 5.5% ] 5.47% | 96,076 | 0.42% |