Italian vs Immigrants from Armenia Disability Age Under 5
COMPARE
Italian
Immigrants from Armenia
Disability Age Under 5
Disability Age Under 5 Comparison
Italians
Immigrants from Armenia
1.6%
DISABILITY AGE UNDER 5
0.0/ 100
METRIC RATING
292nd/ 347
METRIC RANK
0.76%
DISABILITY AGE UNDER 5
100.0/ 100
METRIC RATING
1st/ 347
METRIC RANK
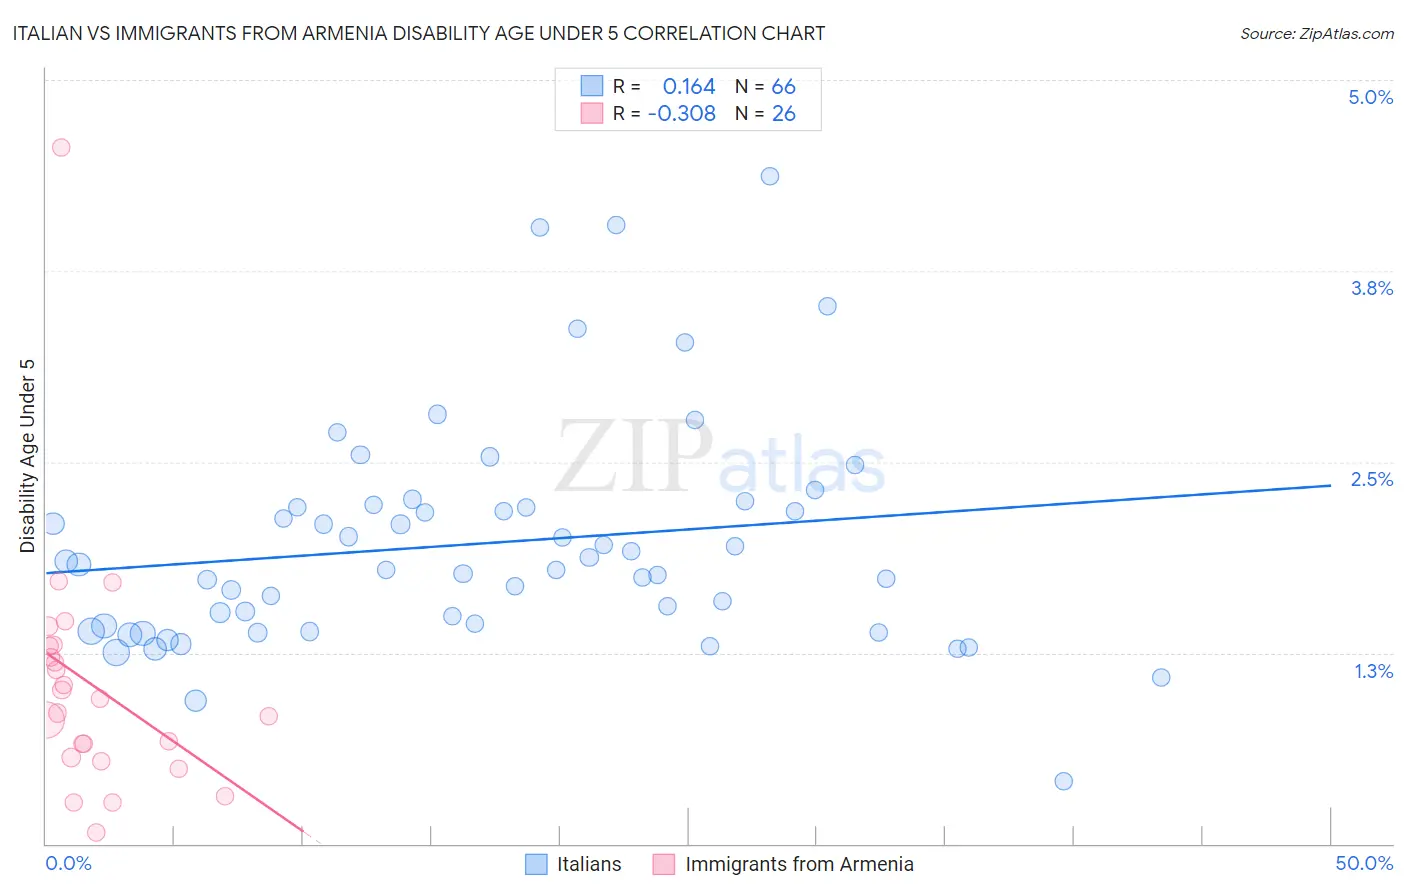
Italian vs Immigrants from Armenia Disability Age Under 5 Correlation Chart
The statistical analysis conducted on geographies consisting of 261,419,311 people shows a poor positive correlation between the proportion of Italians and percentage of population with a disability under the age of 5 in the United States with a correlation coefficient (R) of 0.164 and weighted average of 1.6%. Similarly, the statistical analysis conducted on geographies consisting of 73,758,822 people shows a mild negative correlation between the proportion of Immigrants from Armenia and percentage of population with a disability under the age of 5 in the United States with a correlation coefficient (R) of -0.308 and weighted average of 0.76%, a difference of 105.4%.
Disability Age Under 5 Correlation Summary
| Measurement | Italian | Immigrants from Armenia |
| Minimum | 0.41% | 0.070% |
| Maximum | 4.4% | 4.6% |
| Range | 4.0% | 4.5% |
| Mean | 2.0% | 1.0% |
| Median | 1.8% | 0.90% |
| Interquartile 25% (IQ1) | 1.4% | 0.57% |
| Interquartile 75% (IQ3) | 2.2% | 1.3% |
| Interquartile Range (IQR) | 0.78% | 0.73% |
| Standard Deviation (Sample) | 0.74% | 0.84% |
| Standard Deviation (Population) | 0.73% | 0.83% |
Similar Demographics by Disability Age Under 5
Demographics Similar to Italians by Disability Age Under 5
In terms of disability age under 5, the demographic groups most similar to Italians are Northern European (1.6%, a difference of 0.14%), Czech (1.5%, a difference of 0.24%), Hungarian (1.5%, a difference of 0.37%), Lithuanian (1.6%, a difference of 0.46%), and Estonian (1.5%, a difference of 0.50%).
| Demographics | Rating | Rank | Disability Age Under 5 |
| Croatians | 0.0 /100 | #285 | Tragic 1.5% |
| Tlingit-Haida | 0.0 /100 | #286 | Tragic 1.5% |
| Scandinavians | 0.0 /100 | #287 | Tragic 1.5% |
| Estonians | 0.0 /100 | #288 | Tragic 1.5% |
| Hungarians | 0.0 /100 | #289 | Tragic 1.5% |
| Czechs | 0.0 /100 | #290 | Tragic 1.5% |
| Northern Europeans | 0.0 /100 | #291 | Tragic 1.6% |
| Italians | 0.0 /100 | #292 | Tragic 1.6% |
| Lithuanians | 0.0 /100 | #293 | Tragic 1.6% |
| Swedes | 0.0 /100 | #294 | Tragic 1.6% |
| Finns | 0.0 /100 | #295 | Tragic 1.6% |
| Poles | 0.0 /100 | #296 | Tragic 1.6% |
| Immigrants | Nonimmigrants | 0.0 /100 | #297 | Tragic 1.6% |
| Cajuns | 0.0 /100 | #298 | Tragic 1.6% |
| Portuguese | 0.0 /100 | #299 | Tragic 1.6% |
Demographics Similar to Immigrants from Armenia by Disability Age Under 5
In terms of disability age under 5, the demographic groups most similar to Immigrants from Armenia are Immigrants from St. Vincent and the Grenadines (0.79%, a difference of 4.1%), Vietnamese (0.81%, a difference of 7.4%), Immigrants from Uzbekistan (0.85%, a difference of 12.3%), Immigrants from Bangladesh (0.85%, a difference of 12.8%), and Ute (0.86%, a difference of 13.8%).
| Demographics | Rating | Rank | Disability Age Under 5 |
| Immigrants | Armenia | 100.0 /100 | #1 | Exceptional 0.76% |
| Immigrants | St. Vincent and the Grenadines | 100.0 /100 | #2 | Exceptional 0.79% |
| Vietnamese | 100.0 /100 | #3 | Exceptional 0.81% |
| Immigrants | Uzbekistan | 100.0 /100 | #4 | Exceptional 0.85% |
| Immigrants | Bangladesh | 100.0 /100 | #5 | Exceptional 0.85% |
| Ute | 100.0 /100 | #6 | Exceptional 0.86% |
| Immigrants | Afghanistan | 100.0 /100 | #7 | Exceptional 0.91% |
| Immigrants | Yemen | 100.0 /100 | #8 | Exceptional 0.91% |
| Immigrants | Fiji | 100.0 /100 | #9 | Exceptional 0.92% |
| Marshallese | 100.0 /100 | #10 | Exceptional 0.94% |
| Afghans | 100.0 /100 | #11 | Exceptional 0.94% |
| Immigrants | Grenada | 100.0 /100 | #12 | Exceptional 0.94% |
| Soviet Union | 100.0 /100 | #13 | Exceptional 0.95% |
| Yuman | 100.0 /100 | #14 | Exceptional 0.95% |
| Immigrants | Hong Kong | 100.0 /100 | #15 | Exceptional 0.95% |