Palestinian Disability Age Under 5
COMPARE
Palestinian
Select to Compare
Disability Age Under 5
Palestinian Disability Age Under 5
1.2%
DISABILITY | AGE UNDER 5
43.0/ 100
METRIC RATING
184th/ 347
METRIC RANK
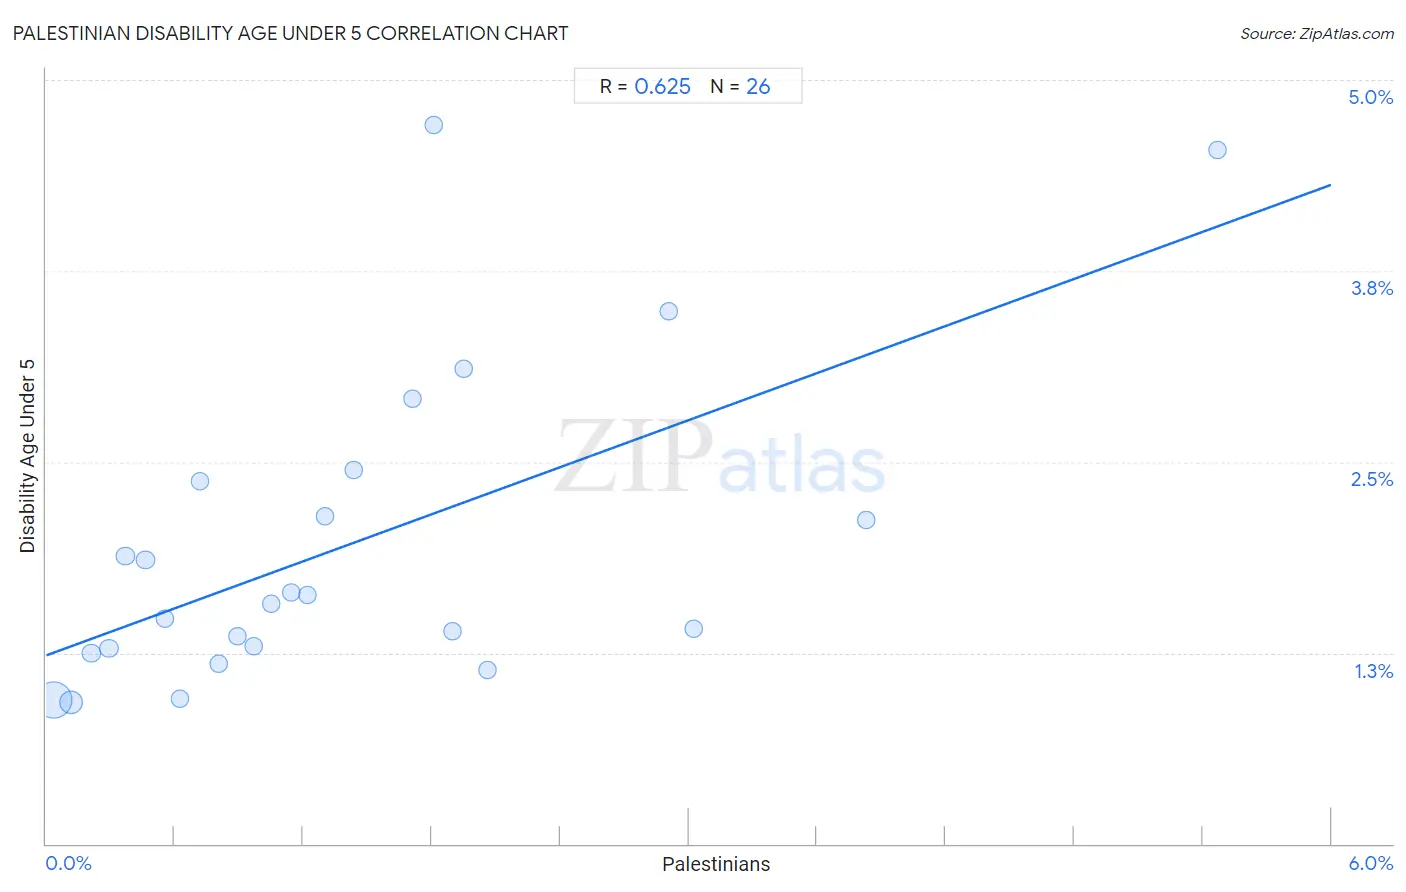
Palestinian Disability Age Under 5 Correlation Chart
The statistical analysis conducted on geographies consisting of 140,188,705 people shows a significant positive correlation between the proportion of Palestinians and percentage of population with a disability under the age of 5 in the United States with a correlation coefficient (R) of 0.625 and weighted average of 1.2%. On average, for every 1% (one percent) increase in Palestinians within a typical geography, there is an increase of 0.51% in percentage of population with a disability under the age of 5.
It is essential to understand that the correlation between the percentage of Palestinians and percentage of population with a disability under the age of 5 does not imply a direct cause-and-effect relationship. It remains uncertain whether the presence of Palestinians influences an upward or downward trend in the level of percentage of population with a disability under the age of 5 within an area, or if Palestinians simply ended up residing in those areas with higher or lower levels of percentage of population with a disability under the age of 5 due to other factors.
Demographics Similar to Palestinians by Disability Age Under 5
In terms of disability age under 5, the demographic groups most similar to Palestinians are Immigrants from Saudi Arabia (1.2%, a difference of 0.020%), Immigrants from Western Africa (1.2%, a difference of 0.050%), Cuban (1.2%, a difference of 0.050%), Macedonian (1.2%, a difference of 0.060%), and Immigrants from Peru (1.2%, a difference of 0.060%).
| Demographics | Rating | Rank | Disability Age Under 5 |
| Comanche | 47.5 /100 | #177 | Average 1.2% |
| Venezuelans | 47.1 /100 | #178 | Average 1.2% |
| Immigrants from Bahamas | 45.2 /100 | #179 | Average 1.2% |
| Immigrants from Mexico | 44.4 /100 | #180 | Average 1.2% |
| Macedonians | 43.7 /100 | #181 | Average 1.2% |
| Immigrants from Peru | 43.7 /100 | #181 | Average 1.2% |
| Immigrants from Saudi Arabia | 43.3 /100 | #183 | Average 1.2% |
| Palestinians | 43.0 /100 | #184 | Average 1.2% |
| Immigrants from Western Africa | 42.5 /100 | #185 | Average 1.2% |
| Cubans | 42.5 /100 | #186 | Average 1.2% |
| Immigrants from Haiti | 40.2 /100 | #187 | Average 1.3% |
| Haitians | 39.9 /100 | #188 | Fair 1.3% |
| Peruvians | 37.6 /100 | #189 | Fair 1.3% |
| Immigrants from Laos | 36.6 /100 | #190 | Fair 1.3% |
| Mexican American Indians | 36.6 /100 | #191 | Fair 1.3% |
Palestinian Disability Age Under 5 Correlation Summary
| Measurement | Palestinian Data | Disability Age Under 5 Data |
| Minimum | 0.037% | 0.93% |
| Maximum | 5.5% | 4.7% |
| Range | 5.4% | 3.8% |
| Mean | 1.4% | 2.0% |
| Median | 1.1% | 1.6% |
| Interquartile 25% (IQ1) | 0.55% | 1.3% |
| Interquartile 75% (IQ3) | 1.9% | 2.4% |
| Interquartile Range (IQR) | 1.3% | 1.1% |
| Standard Deviation (Sample) | 1.3% | 1.0% |
| Standard Deviation (Population) | 1.2% | 1.0% |
Correlation Details
| Palestinian Percentile | Sample Size | Disability Age Under 5 |
[ 0.0% - 0.5% ] 0.037% | 96,950,380 | 0.94% |
[ 0.0% - 0.5% ] 0.12% | 27,370,059 | 0.93% |
[ 0.0% - 0.5% ] 0.21% | 5,881,147 | 1.2% |
[ 0.0% - 0.5% ] 0.29% | 3,909,114 | 1.3% |
[ 0.0% - 0.5% ] 0.37% | 1,919,388 | 1.9% |
[ 0.0% - 0.5% ] 0.46% | 1,178,438 | 1.9% |
[ 0.5% - 1.0% ] 0.55% | 740,610 | 1.5% |
[ 0.5% - 1.0% ] 0.62% | 450,547 | 0.95% |
[ 0.5% - 1.0% ] 0.72% | 407,956 | 2.4% |
[ 0.5% - 1.0% ] 0.80% | 194,418 | 1.2% |
[ 0.5% - 1.0% ] 0.89% | 234,572 | 1.4% |
[ 0.5% - 1.0% ] 0.97% | 223,212 | 1.3% |
[ 1.0% - 1.5% ] 1.05% | 139,740 | 1.6% |
[ 1.0% - 1.5% ] 1.14% | 80,038 | 1.6% |
[ 1.0% - 1.5% ] 1.22% | 39,952 | 1.6% |
[ 1.0% - 1.5% ] 1.30% | 126,795 | 2.1% |
[ 1.0% - 1.5% ] 1.44% | 11,261 | 2.4% |
[ 1.5% - 2.0% ] 1.71% | 8,881 | 2.9% |
[ 1.5% - 2.0% ] 1.81% | 41,177 | 4.7% |
[ 1.5% - 2.0% ] 1.90% | 70,717 | 1.4% |
[ 1.5% - 2.0% ] 1.95% | 40,940 | 3.1% |
[ 2.0% - 2.5% ] 2.06% | 100,871 | 1.1% |
[ 2.5% - 3.0% ] 2.91% | 22,318 | 3.5% |
[ 3.0% - 3.5% ] 3.02% | 33,887 | 1.4% |
[ 3.5% - 4.0% ] 3.83% | 8,065 | 2.1% |
[ 5.0% - 5.5% ] 5.47% | 4,222 | 4.5% |