Italian vs Creek Disability Age Under 5
COMPARE
Italian
Creek
Disability Age Under 5
Disability Age Under 5 Comparison
Italians
Creek
1.6%
DISABILITY AGE UNDER 5
0.0/ 100
METRIC RATING
292nd/ 347
METRIC RANK
1.6%
DISABILITY AGE UNDER 5
0.0/ 100
METRIC RATING
306th/ 347
METRIC RANK
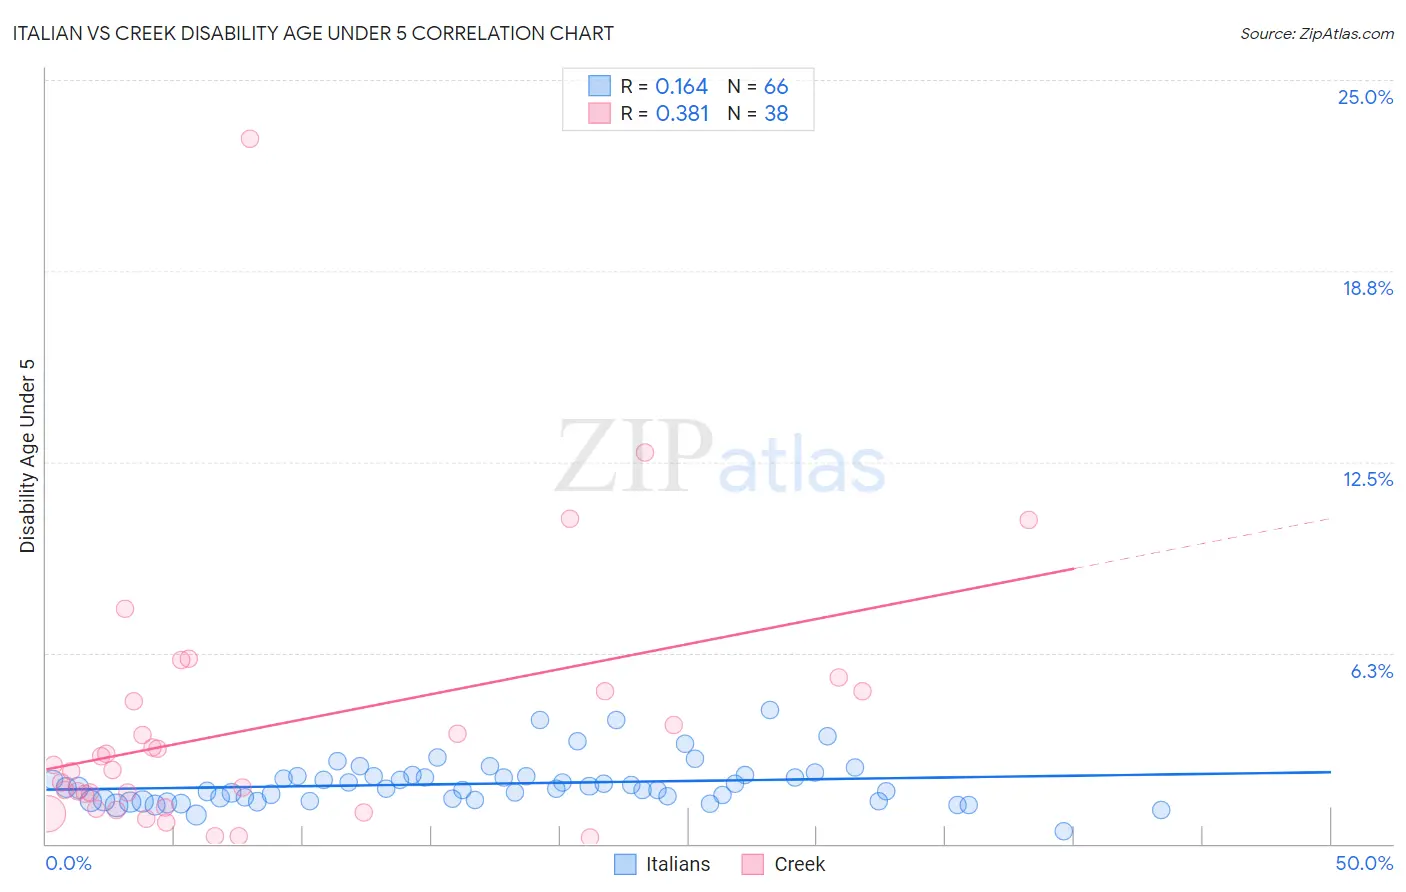
Italian vs Creek Disability Age Under 5 Correlation Chart
The statistical analysis conducted on geographies consisting of 261,419,311 people shows a poor positive correlation between the proportion of Italians and percentage of population with a disability under the age of 5 in the United States with a correlation coefficient (R) of 0.164 and weighted average of 1.6%. Similarly, the statistical analysis conducted on geographies consisting of 124,448,174 people shows a mild positive correlation between the proportion of Creek and percentage of population with a disability under the age of 5 in the United States with a correlation coefficient (R) of 0.381 and weighted average of 1.6%, a difference of 5.9%.
Disability Age Under 5 Correlation Summary
| Measurement | Italian | Creek |
| Minimum | 0.41% | 0.21% |
| Maximum | 4.4% | 23.1% |
| Range | 4.0% | 22.9% |
| Mean | 2.0% | 3.9% |
| Median | 1.8% | 2.5% |
| Interquartile 25% (IQ1) | 1.4% | 1.2% |
| Interquartile 75% (IQ3) | 2.2% | 5.0% |
| Interquartile Range (IQR) | 0.78% | 3.8% |
| Standard Deviation (Sample) | 0.74% | 4.4% |
| Standard Deviation (Population) | 0.73% | 4.3% |
Demographics Similar to Italians and Creek by Disability Age Under 5
In terms of disability age under 5, the demographic groups most similar to Italians are Northern European (1.6%, a difference of 0.14%), Czech (1.5%, a difference of 0.24%), Hungarian (1.5%, a difference of 0.37%), Lithuanian (1.6%, a difference of 0.46%), and Swedish (1.6%, a difference of 1.7%). Similarly, the demographic groups most similar to Creek are Blackfeet (1.6%, a difference of 0.040%), Scottish (1.6%, a difference of 0.070%), Seminole (1.6%, a difference of 0.19%), Navajo (1.6%, a difference of 0.21%), and Swiss (1.6%, a difference of 0.83%).
| Demographics | Rating | Rank | Disability Age Under 5 |
| Hungarians | 0.0 /100 | #289 | Tragic 1.5% |
| Czechs | 0.0 /100 | #290 | Tragic 1.5% |
| Northern Europeans | 0.0 /100 | #291 | Tragic 1.6% |
| Italians | 0.0 /100 | #292 | Tragic 1.6% |
| Lithuanians | 0.0 /100 | #293 | Tragic 1.6% |
| Swedes | 0.0 /100 | #294 | Tragic 1.6% |
| Finns | 0.0 /100 | #295 | Tragic 1.6% |
| Poles | 0.0 /100 | #296 | Tragic 1.6% |
| Immigrants | Nonimmigrants | 0.0 /100 | #297 | Tragic 1.6% |
| Cajuns | 0.0 /100 | #298 | Tragic 1.6% |
| Portuguese | 0.0 /100 | #299 | Tragic 1.6% |
| Shoshone | 0.0 /100 | #300 | Tragic 1.6% |
| German Russians | 0.0 /100 | #301 | Tragic 1.6% |
| Welsh | 0.0 /100 | #302 | Tragic 1.6% |
| Swiss | 0.0 /100 | #303 | Tragic 1.6% |
| Seminole | 0.0 /100 | #304 | Tragic 1.6% |
| Blackfeet | 0.0 /100 | #305 | Tragic 1.6% |
| Creek | 0.0 /100 | #306 | Tragic 1.6% |
| Scottish | 0.0 /100 | #307 | Tragic 1.6% |
| Navajo | 0.0 /100 | #308 | Tragic 1.6% |
| Cape Verdeans | 0.0 /100 | #309 | Tragic 1.7% |