Italian vs Houma Disability Age Under 5
COMPARE
Italian
Houma
Disability Age Under 5
Disability Age Under 5 Comparison
Italians
Houma
1.6%
DISABILITY AGE UNDER 5
0.0/ 100
METRIC RATING
292nd/ 347
METRIC RANK
1.9%
DISABILITY AGE UNDER 5
0.0/ 100
METRIC RATING
329th/ 347
METRIC RANK
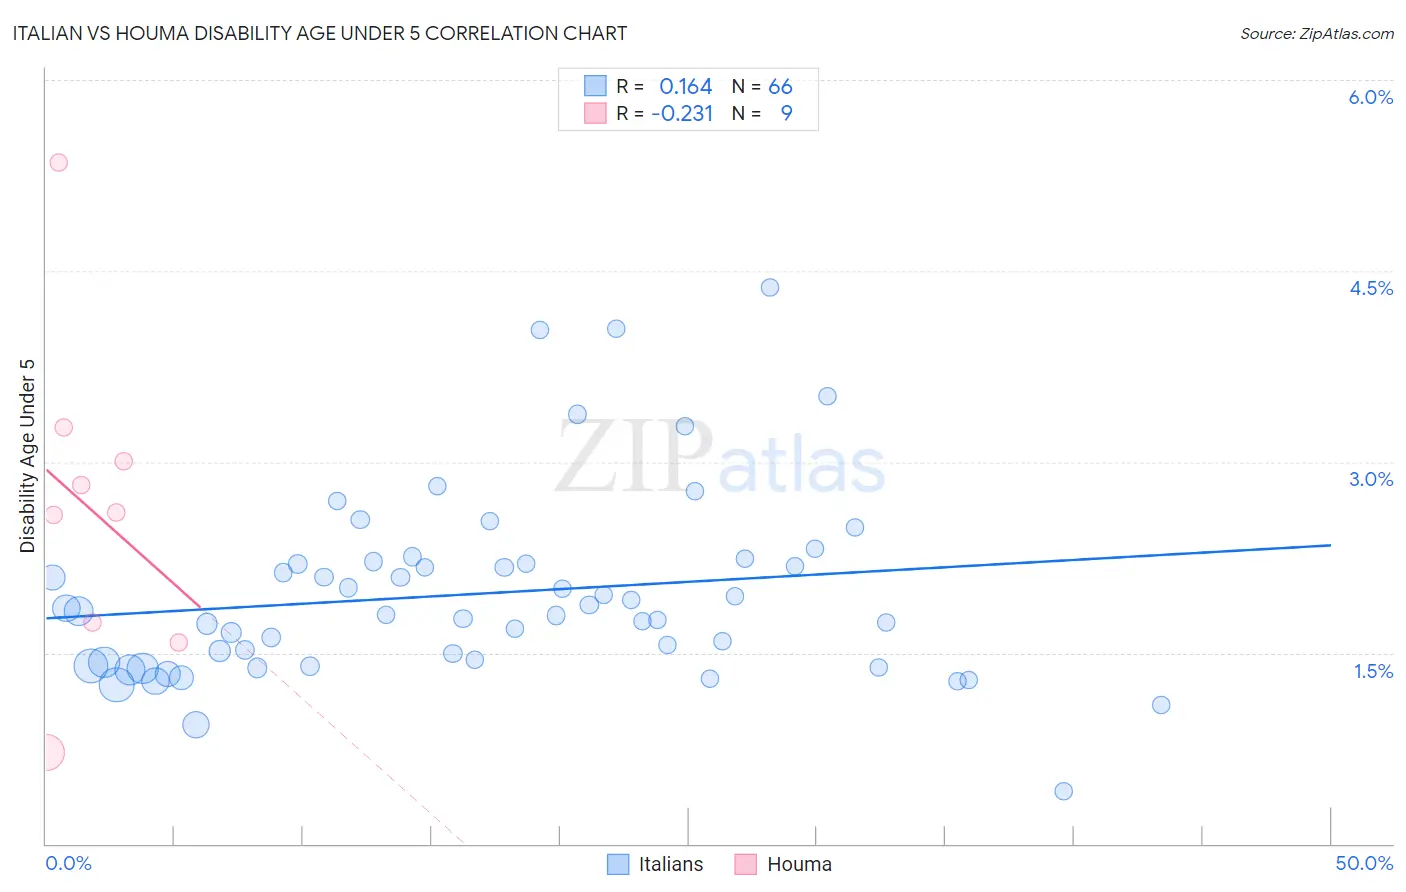
Italian vs Houma Disability Age Under 5 Correlation Chart
The statistical analysis conducted on geographies consisting of 261,419,311 people shows a poor positive correlation between the proportion of Italians and percentage of population with a disability under the age of 5 in the United States with a correlation coefficient (R) of 0.164 and weighted average of 1.6%. Similarly, the statistical analysis conducted on geographies consisting of 31,359,385 people shows a weak negative correlation between the proportion of Houma and percentage of population with a disability under the age of 5 in the United States with a correlation coefficient (R) of -0.231 and weighted average of 1.9%, a difference of 20.2%.
Disability Age Under 5 Correlation Summary
| Measurement | Italian | Houma |
| Minimum | 0.41% | 0.72% |
| Maximum | 4.4% | 5.4% |
| Range | 4.0% | 4.6% |
| Mean | 2.0% | 2.6% |
| Median | 1.8% | 2.6% |
| Interquartile 25% (IQ1) | 1.4% | 1.7% |
| Interquartile 75% (IQ3) | 2.2% | 3.1% |
| Interquartile Range (IQR) | 0.78% | 1.5% |
| Standard Deviation (Sample) | 0.74% | 1.3% |
| Standard Deviation (Population) | 0.73% | 1.2% |
Similar Demographics by Disability Age Under 5
Demographics Similar to Italians by Disability Age Under 5
In terms of disability age under 5, the demographic groups most similar to Italians are Northern European (1.6%, a difference of 0.14%), Czech (1.5%, a difference of 0.24%), Hungarian (1.5%, a difference of 0.37%), Lithuanian (1.6%, a difference of 0.46%), and Estonian (1.5%, a difference of 0.50%).
| Demographics | Rating | Rank | Disability Age Under 5 |
| Croatians | 0.0 /100 | #285 | Tragic 1.5% |
| Tlingit-Haida | 0.0 /100 | #286 | Tragic 1.5% |
| Scandinavians | 0.0 /100 | #287 | Tragic 1.5% |
| Estonians | 0.0 /100 | #288 | Tragic 1.5% |
| Hungarians | 0.0 /100 | #289 | Tragic 1.5% |
| Czechs | 0.0 /100 | #290 | Tragic 1.5% |
| Northern Europeans | 0.0 /100 | #291 | Tragic 1.6% |
| Italians | 0.0 /100 | #292 | Tragic 1.6% |
| Lithuanians | 0.0 /100 | #293 | Tragic 1.6% |
| Swedes | 0.0 /100 | #294 | Tragic 1.6% |
| Finns | 0.0 /100 | #295 | Tragic 1.6% |
| Poles | 0.0 /100 | #296 | Tragic 1.6% |
| Immigrants | Nonimmigrants | 0.0 /100 | #297 | Tragic 1.6% |
| Cajuns | 0.0 /100 | #298 | Tragic 1.6% |
| Portuguese | 0.0 /100 | #299 | Tragic 1.6% |
Demographics Similar to Houma by Disability Age Under 5
In terms of disability age under 5, the demographic groups most similar to Houma are Choctaw (1.9%, a difference of 0.32%), American (1.9%, a difference of 0.47%), French Canadian (1.9%, a difference of 0.62%), Chippewa (1.9%, a difference of 0.69%), and Osage (1.8%, a difference of 2.2%).
| Demographics | Rating | Rank | Disability Age Under 5 |
| Germans | 0.0 /100 | #322 | Tragic 1.7% |
| Chickasaw | 0.0 /100 | #323 | Tragic 1.7% |
| Cherokee | 0.0 /100 | #324 | Tragic 1.8% |
| Immigrants | Portugal | 0.0 /100 | #325 | Tragic 1.8% |
| Sioux | 0.0 /100 | #326 | Tragic 1.8% |
| Osage | 0.0 /100 | #327 | Tragic 1.8% |
| Americans | 0.0 /100 | #328 | Tragic 1.9% |
| Houma | 0.0 /100 | #329 | Tragic 1.9% |
| Choctaw | 0.0 /100 | #330 | Tragic 1.9% |
| French Canadians | 0.0 /100 | #331 | Tragic 1.9% |
| Chippewa | 0.0 /100 | #332 | Tragic 1.9% |
| Dutch West Indians | 0.0 /100 | #333 | Tragic 1.9% |
| Natives/Alaskans | 0.0 /100 | #334 | Tragic 1.9% |
| Pennsylvania Germans | 0.0 /100 | #335 | Tragic 1.9% |
| Paraguayans | 0.0 /100 | #336 | Tragic 2.0% |