Immigrants from Poland vs Estonian Disability Age Under 5
COMPARE
Immigrants from Poland
Estonian
Disability Age Under 5
Disability Age Under 5 Comparison
Immigrants from Poland
Estonians
1.3%
DISABILITY AGE UNDER 5
22.4/ 100
METRIC RATING
206th/ 347
METRIC RANK
1.5%
DISABILITY AGE UNDER 5
0.0/ 100
METRIC RATING
288th/ 347
METRIC RANK
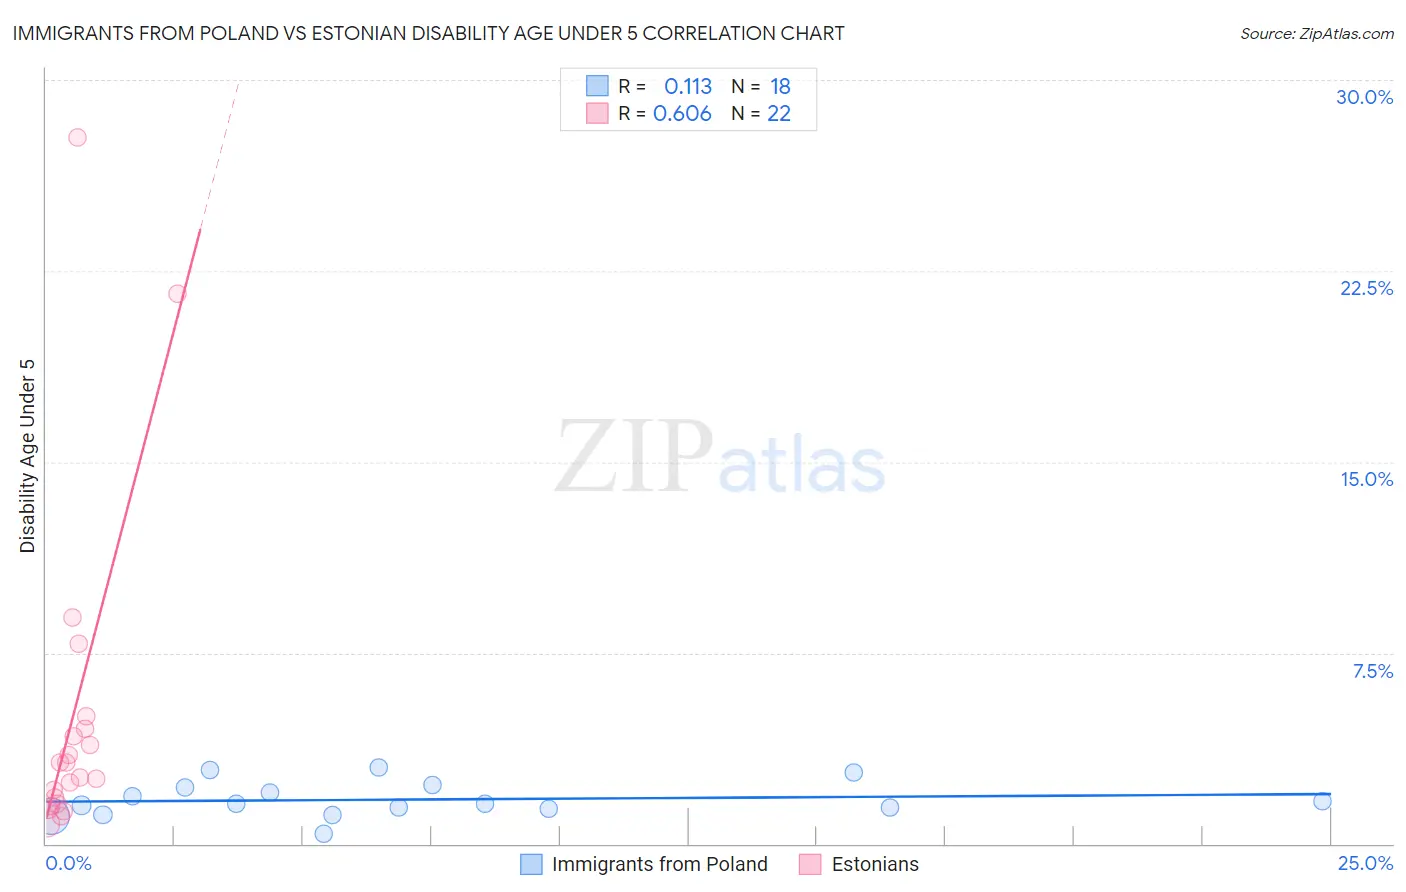
Immigrants from Poland vs Estonian Disability Age Under 5 Correlation Chart
The statistical analysis conducted on geographies consisting of 173,203,351 people shows a poor positive correlation between the proportion of Immigrants from Poland and percentage of population with a disability under the age of 5 in the United States with a correlation coefficient (R) of 0.113 and weighted average of 1.3%. Similarly, the statistical analysis conducted on geographies consisting of 87,399,197 people shows a significant positive correlation between the proportion of Estonians and percentage of population with a disability under the age of 5 in the United States with a correlation coefficient (R) of 0.606 and weighted average of 1.5%, a difference of 21.3%.
Disability Age Under 5 Correlation Summary
| Measurement | Immigrants from Poland | Estonian |
| Minimum | 0.38% | 0.77% |
| Maximum | 3.0% | 27.7% |
| Range | 2.6% | 27.0% |
| Mean | 1.7% | 5.1% |
| Median | 1.6% | 2.9% |
| Interquartile 25% (IQ1) | 1.4% | 1.6% |
| Interquartile 75% (IQ3) | 2.2% | 4.5% |
| Interquartile Range (IQR) | 0.82% | 2.9% |
| Standard Deviation (Sample) | 0.69% | 6.7% |
| Standard Deviation (Population) | 0.67% | 6.6% |
Similar Demographics by Disability Age Under 5
Demographics Similar to Immigrants from Poland by Disability Age Under 5
In terms of disability age under 5, the demographic groups most similar to Immigrants from Poland are Romanian (1.3%, a difference of 0.020%), Nigerian (1.3%, a difference of 0.15%), Immigrants from Europe (1.3%, a difference of 0.16%), Liberian (1.3%, a difference of 0.20%), and Mexican (1.3%, a difference of 0.21%).
| Demographics | Rating | Rank | Disability Age Under 5 |
| Jamaicans | 30.7 /100 | #199 | Fair 1.3% |
| Immigrants | Lithuania | 27.2 /100 | #200 | Fair 1.3% |
| Immigrants | Italy | 25.4 /100 | #201 | Fair 1.3% |
| Arapaho | 24.1 /100 | #202 | Fair 1.3% |
| Liberians | 24.0 /100 | #203 | Fair 1.3% |
| Immigrants | Europe | 23.6 /100 | #204 | Fair 1.3% |
| Romanians | 22.5 /100 | #205 | Fair 1.3% |
| Immigrants | Poland | 22.4 /100 | #206 | Fair 1.3% |
| Nigerians | 21.2 /100 | #207 | Fair 1.3% |
| Mexicans | 20.8 /100 | #208 | Fair 1.3% |
| Bulgarians | 19.5 /100 | #209 | Poor 1.3% |
| Pakistanis | 19.4 /100 | #210 | Poor 1.3% |
| Immigrants | Greece | 19.1 /100 | #211 | Poor 1.3% |
| Chileans | 18.8 /100 | #212 | Poor 1.3% |
| Immigrants | Sudan | 18.7 /100 | #213 | Poor 1.3% |
Demographics Similar to Estonians by Disability Age Under 5
In terms of disability age under 5, the demographic groups most similar to Estonians are Hungarian (1.5%, a difference of 0.14%), Scandinavian (1.5%, a difference of 0.18%), Tlingit-Haida (1.5%, a difference of 0.23%), Czech (1.5%, a difference of 0.26%), and Northern European (1.6%, a difference of 0.36%).
| Demographics | Rating | Rank | Disability Age Under 5 |
| Czechoslovakians | 0.0 /100 | #281 | Tragic 1.5% |
| Cheyenne | 0.0 /100 | #282 | Tragic 1.5% |
| Delaware | 0.0 /100 | #283 | Tragic 1.5% |
| Europeans | 0.0 /100 | #284 | Tragic 1.5% |
| Croatians | 0.0 /100 | #285 | Tragic 1.5% |
| Tlingit-Haida | 0.0 /100 | #286 | Tragic 1.5% |
| Scandinavians | 0.0 /100 | #287 | Tragic 1.5% |
| Estonians | 0.0 /100 | #288 | Tragic 1.5% |
| Hungarians | 0.0 /100 | #289 | Tragic 1.5% |
| Czechs | 0.0 /100 | #290 | Tragic 1.5% |
| Northern Europeans | 0.0 /100 | #291 | Tragic 1.6% |
| Italians | 0.0 /100 | #292 | Tragic 1.6% |
| Lithuanians | 0.0 /100 | #293 | Tragic 1.6% |
| Swedes | 0.0 /100 | #294 | Tragic 1.6% |
| Finns | 0.0 /100 | #295 | Tragic 1.6% |