Immigrants from Poland vs Brazilian Disability Age Under 5
COMPARE
Immigrants from Poland
Brazilian
Disability Age Under 5
Disability Age Under 5 Comparison
Immigrants from Poland
Brazilians
1.3%
DISABILITY AGE UNDER 5
22.4/ 100
METRIC RATING
206th/ 347
METRIC RANK
1.5%
DISABILITY AGE UNDER 5
0.0/ 100
METRIC RATING
275th/ 347
METRIC RANK
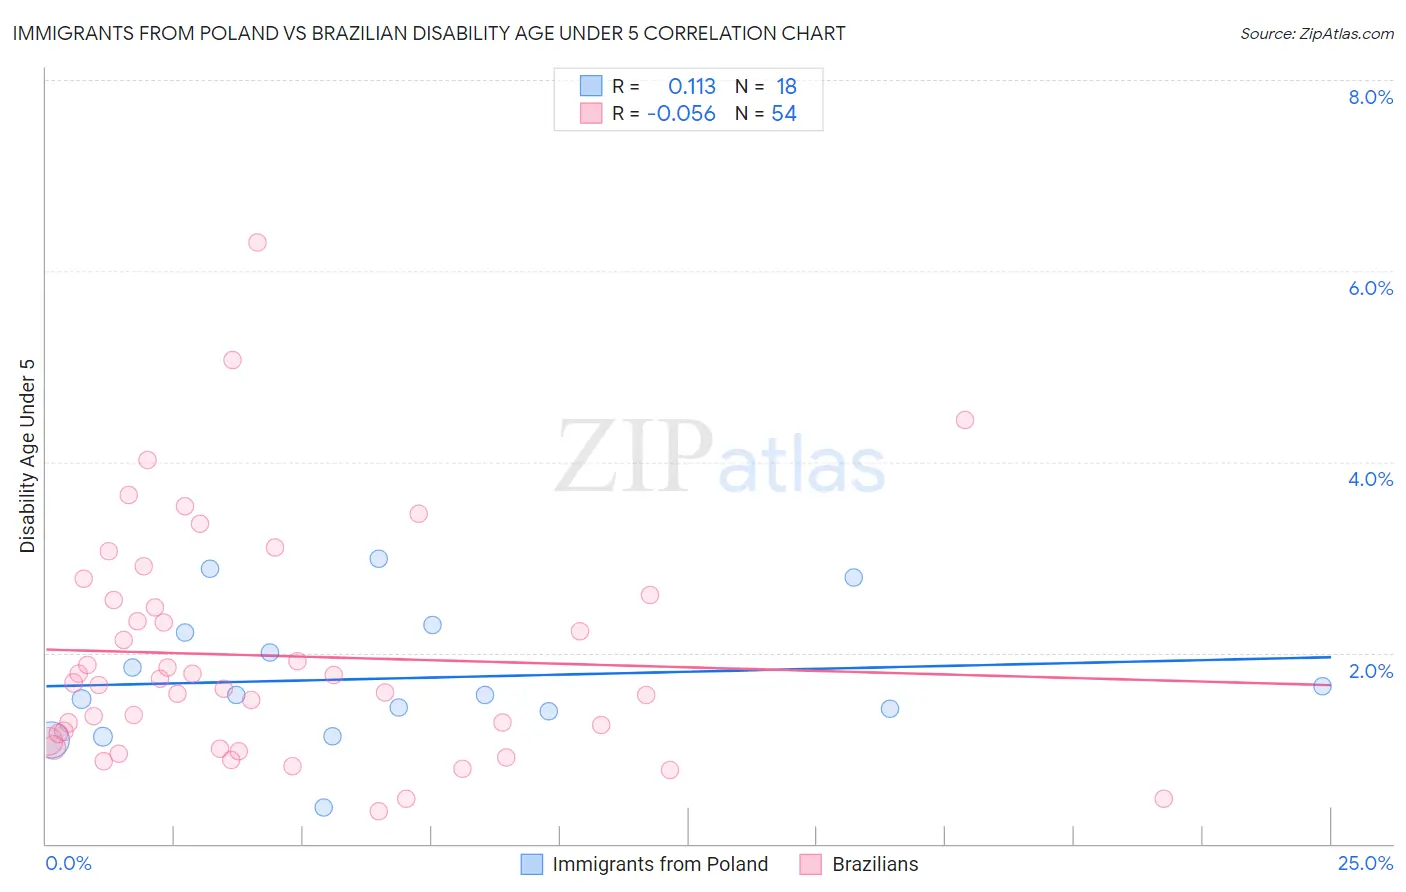
Immigrants from Poland vs Brazilian Disability Age Under 5 Correlation Chart
The statistical analysis conducted on geographies consisting of 173,203,351 people shows a poor positive correlation between the proportion of Immigrants from Poland and percentage of population with a disability under the age of 5 in the United States with a correlation coefficient (R) of 0.113 and weighted average of 1.3%. Similarly, the statistical analysis conducted on geographies consisting of 185,712,155 people shows a slight negative correlation between the proportion of Brazilians and percentage of population with a disability under the age of 5 in the United States with a correlation coefficient (R) of -0.056 and weighted average of 1.5%, a difference of 14.2%.
Disability Age Under 5 Correlation Summary
| Measurement | Immigrants from Poland | Brazilian |
| Minimum | 0.38% | 0.34% |
| Maximum | 3.0% | 6.3% |
| Range | 2.6% | 6.0% |
| Mean | 1.7% | 2.0% |
| Median | 1.6% | 1.7% |
| Interquartile 25% (IQ1) | 1.4% | 1.1% |
| Interquartile 75% (IQ3) | 2.2% | 2.5% |
| Interquartile Range (IQR) | 0.82% | 1.5% |
| Standard Deviation (Sample) | 0.69% | 1.2% |
| Standard Deviation (Population) | 0.67% | 1.2% |
Similar Demographics by Disability Age Under 5
Demographics Similar to Immigrants from Poland by Disability Age Under 5
In terms of disability age under 5, the demographic groups most similar to Immigrants from Poland are Romanian (1.3%, a difference of 0.020%), Nigerian (1.3%, a difference of 0.15%), Immigrants from Europe (1.3%, a difference of 0.16%), Liberian (1.3%, a difference of 0.20%), and Mexican (1.3%, a difference of 0.21%).
| Demographics | Rating | Rank | Disability Age Under 5 |
| Jamaicans | 30.7 /100 | #199 | Fair 1.3% |
| Immigrants | Lithuania | 27.2 /100 | #200 | Fair 1.3% |
| Immigrants | Italy | 25.4 /100 | #201 | Fair 1.3% |
| Arapaho | 24.1 /100 | #202 | Fair 1.3% |
| Liberians | 24.0 /100 | #203 | Fair 1.3% |
| Immigrants | Europe | 23.6 /100 | #204 | Fair 1.3% |
| Romanians | 22.5 /100 | #205 | Fair 1.3% |
| Immigrants | Poland | 22.4 /100 | #206 | Fair 1.3% |
| Nigerians | 21.2 /100 | #207 | Fair 1.3% |
| Mexicans | 20.8 /100 | #208 | Fair 1.3% |
| Bulgarians | 19.5 /100 | #209 | Poor 1.3% |
| Pakistanis | 19.4 /100 | #210 | Poor 1.3% |
| Immigrants | Greece | 19.1 /100 | #211 | Poor 1.3% |
| Chileans | 18.8 /100 | #212 | Poor 1.3% |
| Immigrants | Sudan | 18.7 /100 | #213 | Poor 1.3% |
Demographics Similar to Brazilians by Disability Age Under 5
In terms of disability age under 5, the demographic groups most similar to Brazilians are Iroquois (1.5%, a difference of 0.11%), Alaskan Athabascan (1.5%, a difference of 0.38%), Greek (1.5%, a difference of 0.57%), Black/African American (1.4%, a difference of 0.67%), and Immigrants from Canada (1.4%, a difference of 0.83%).
| Demographics | Rating | Rank | Disability Age Under 5 |
| Belgians | 0.1 /100 | #268 | Tragic 1.4% |
| Austrians | 0.1 /100 | #269 | Tragic 1.4% |
| Immigrants | North America | 0.1 /100 | #270 | Tragic 1.4% |
| Immigrants | Canada | 0.1 /100 | #271 | Tragic 1.4% |
| Blacks/African Americans | 0.1 /100 | #272 | Tragic 1.4% |
| Alaskan Athabascans | 0.1 /100 | #273 | Tragic 1.5% |
| Iroquois | 0.0 /100 | #274 | Tragic 1.5% |
| Brazilians | 0.0 /100 | #275 | Tragic 1.5% |
| Greeks | 0.0 /100 | #276 | Tragic 1.5% |
| Canadians | 0.0 /100 | #277 | Tragic 1.5% |
| Kiowa | 0.0 /100 | #278 | Tragic 1.5% |
| Danes | 0.0 /100 | #279 | Tragic 1.5% |
| British | 0.0 /100 | #280 | Tragic 1.5% |
| Czechoslovakians | 0.0 /100 | #281 | Tragic 1.5% |
| Cheyenne | 0.0 /100 | #282 | Tragic 1.5% |