Immigrants from Poland vs Immigrants from Nigeria Disability Age Under 5
COMPARE
Immigrants from Poland
Immigrants from Nigeria
Disability Age Under 5
Disability Age Under 5 Comparison
Immigrants from Poland
Immigrants from Nigeria
1.3%
DISABILITY AGE UNDER 5
22.4/ 100
METRIC RATING
206th/ 347
METRIC RANK
1.2%
DISABILITY AGE UNDER 5
50.0/ 100
METRIC RATING
175th/ 347
METRIC RANK
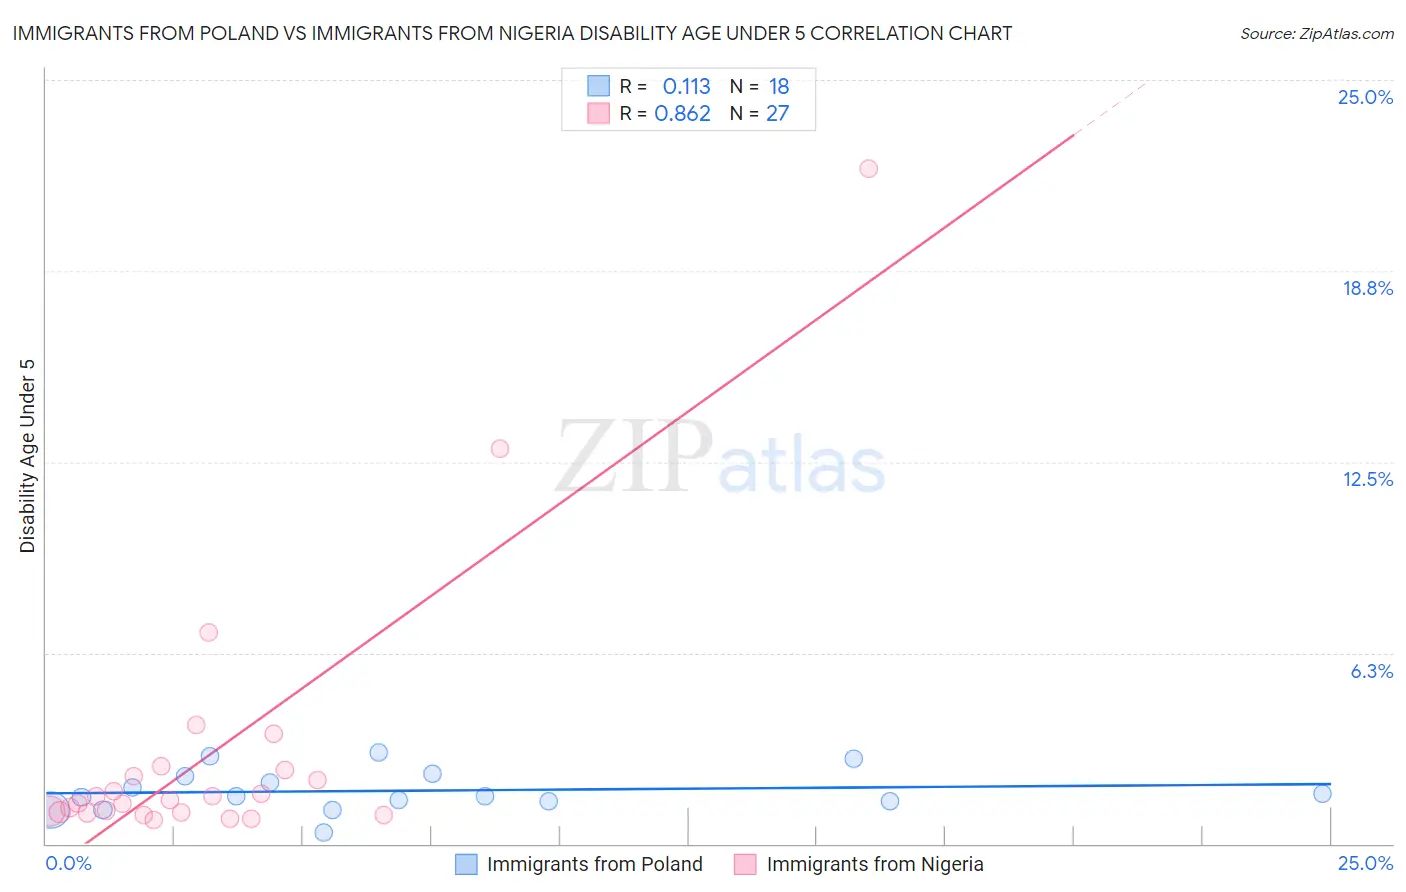
Immigrants from Poland vs Immigrants from Nigeria Disability Age Under 5 Correlation Chart
The statistical analysis conducted on geographies consisting of 173,203,351 people shows a poor positive correlation between the proportion of Immigrants from Poland and percentage of population with a disability under the age of 5 in the United States with a correlation coefficient (R) of 0.113 and weighted average of 1.3%. Similarly, the statistical analysis conducted on geographies consisting of 173,767,692 people shows a very strong positive correlation between the proportion of Immigrants from Nigeria and percentage of population with a disability under the age of 5 in the United States with a correlation coefficient (R) of 0.862 and weighted average of 1.2%, a difference of 2.8%.
Disability Age Under 5 Correlation Summary
| Measurement | Immigrants from Poland | Immigrants from Nigeria |
| Minimum | 0.38% | 0.78% |
| Maximum | 3.0% | 22.1% |
| Range | 2.6% | 21.3% |
| Mean | 1.7% | 3.0% |
| Median | 1.6% | 1.4% |
| Interquartile 25% (IQ1) | 1.4% | 1.0% |
| Interquartile 75% (IQ3) | 2.2% | 2.4% |
| Interquartile Range (IQR) | 0.82% | 1.4% |
| Standard Deviation (Sample) | 0.69% | 4.6% |
| Standard Deviation (Population) | 0.67% | 4.5% |
Similar Demographics by Disability Age Under 5
Demographics Similar to Immigrants from Poland by Disability Age Under 5
In terms of disability age under 5, the demographic groups most similar to Immigrants from Poland are Romanian (1.3%, a difference of 0.020%), Nigerian (1.3%, a difference of 0.15%), Immigrants from Europe (1.3%, a difference of 0.16%), Liberian (1.3%, a difference of 0.20%), and Mexican (1.3%, a difference of 0.21%).
| Demographics | Rating | Rank | Disability Age Under 5 |
| Jamaicans | 30.7 /100 | #199 | Fair 1.3% |
| Immigrants | Lithuania | 27.2 /100 | #200 | Fair 1.3% |
| Immigrants | Italy | 25.4 /100 | #201 | Fair 1.3% |
| Arapaho | 24.1 /100 | #202 | Fair 1.3% |
| Liberians | 24.0 /100 | #203 | Fair 1.3% |
| Immigrants | Europe | 23.6 /100 | #204 | Fair 1.3% |
| Romanians | 22.5 /100 | #205 | Fair 1.3% |
| Immigrants | Poland | 22.4 /100 | #206 | Fair 1.3% |
| Nigerians | 21.2 /100 | #207 | Fair 1.3% |
| Mexicans | 20.8 /100 | #208 | Fair 1.3% |
| Bulgarians | 19.5 /100 | #209 | Poor 1.3% |
| Pakistanis | 19.4 /100 | #210 | Poor 1.3% |
| Immigrants | Greece | 19.1 /100 | #211 | Poor 1.3% |
| Chileans | 18.8 /100 | #212 | Poor 1.3% |
| Immigrants | Sudan | 18.7 /100 | #213 | Poor 1.3% |
Demographics Similar to Immigrants from Nigeria by Disability Age Under 5
In terms of disability age under 5, the demographic groups most similar to Immigrants from Nigeria are Immigrants from Latvia (1.2%, a difference of 0.0%), Immigrants from Ireland (1.2%, a difference of 0.030%), Crow (1.2%, a difference of 0.090%), Immigrants from Kenya (1.2%, a difference of 0.13%), and Comanche (1.2%, a difference of 0.22%).
| Demographics | Rating | Rank | Disability Age Under 5 |
| Sierra Leoneans | 59.1 /100 | #168 | Average 1.2% |
| Immigrants | Uruguay | 59.0 /100 | #169 | Average 1.2% |
| Immigrants | Jamaica | 58.8 /100 | #170 | Average 1.2% |
| Guamanians/Chamorros | 57.8 /100 | #171 | Average 1.2% |
| Crow | 51.0 /100 | #172 | Average 1.2% |
| Immigrants | Ireland | 50.3 /100 | #173 | Average 1.2% |
| Immigrants | Latvia | 50.0 /100 | #174 | Average 1.2% |
| Immigrants | Nigeria | 50.0 /100 | #175 | Average 1.2% |
| Immigrants | Kenya | 48.6 /100 | #176 | Average 1.2% |
| Comanche | 47.5 /100 | #177 | Average 1.2% |
| Venezuelans | 47.1 /100 | #178 | Average 1.2% |
| Immigrants | Bahamas | 45.2 /100 | #179 | Average 1.2% |
| Immigrants | Mexico | 44.4 /100 | #180 | Average 1.2% |
| Macedonians | 43.7 /100 | #181 | Average 1.2% |
| Immigrants | Peru | 43.7 /100 | #181 | Average 1.2% |