Immigrants from Poland vs Paraguayan Disability Age Under 5
COMPARE
Immigrants from Poland
Paraguayan
Disability Age Under 5
Disability Age Under 5 Comparison
Immigrants from Poland
Paraguayans
1.3%
DISABILITY AGE UNDER 5
22.4/ 100
METRIC RATING
206th/ 347
METRIC RANK
2.0%
DISABILITY AGE UNDER 5
0.0/ 100
METRIC RATING
336th/ 347
METRIC RANK
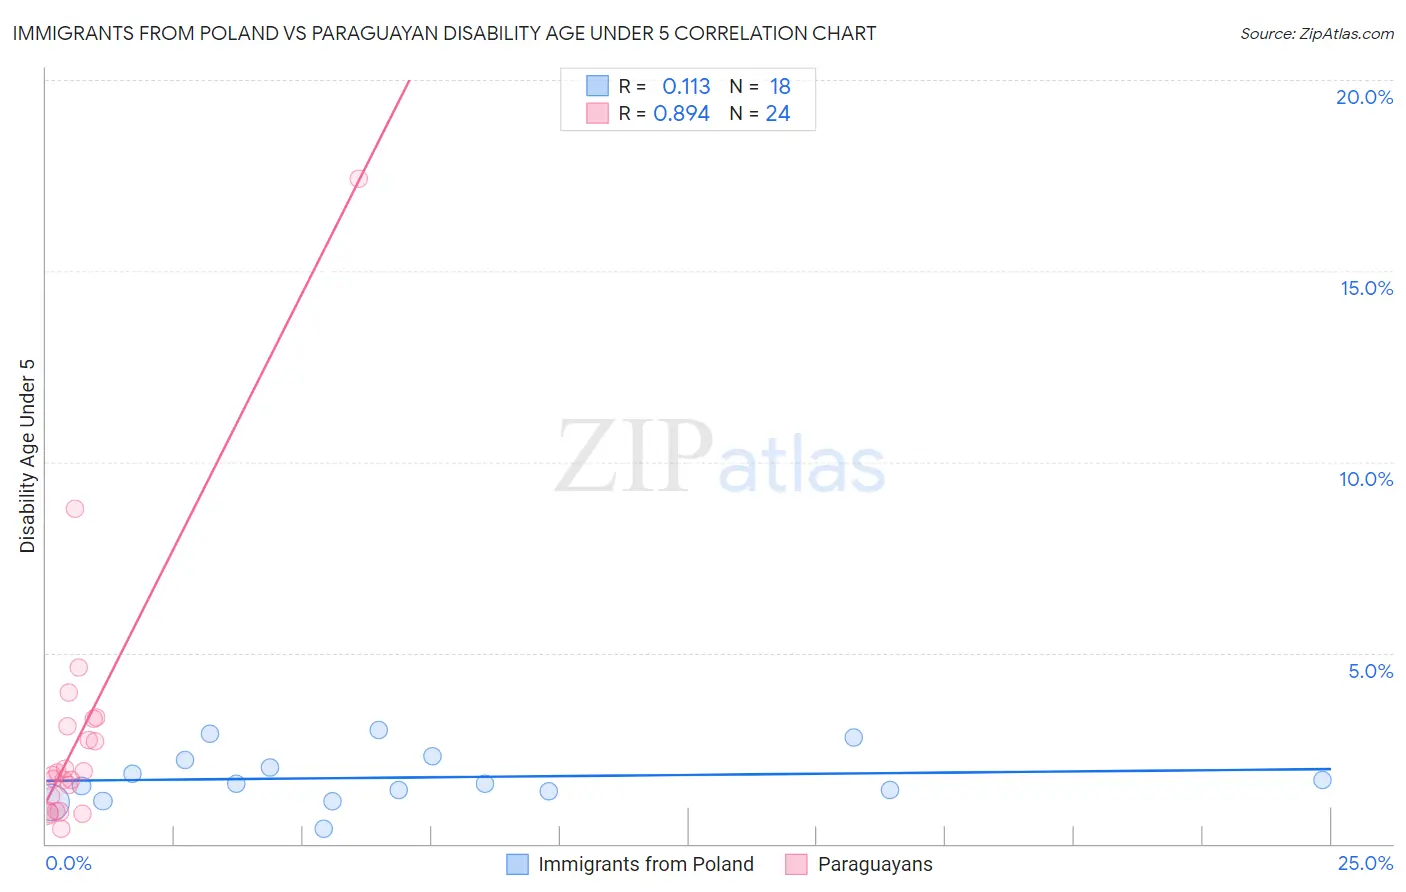
Immigrants from Poland vs Paraguayan Disability Age Under 5 Correlation Chart
The statistical analysis conducted on geographies consisting of 173,203,351 people shows a poor positive correlation between the proportion of Immigrants from Poland and percentage of population with a disability under the age of 5 in the United States with a correlation coefficient (R) of 0.113 and weighted average of 1.3%. Similarly, the statistical analysis conducted on geographies consisting of 72,027,201 people shows a very strong positive correlation between the proportion of Paraguayans and percentage of population with a disability under the age of 5 in the United States with a correlation coefficient (R) of 0.894 and weighted average of 2.0%, a difference of 54.9%.
Disability Age Under 5 Correlation Summary
| Measurement | Immigrants from Poland | Paraguayan |
| Minimum | 0.38% | 0.40% |
| Maximum | 3.0% | 17.4% |
| Range | 2.6% | 17.0% |
| Mean | 1.7% | 2.9% |
| Median | 1.6% | 1.8% |
| Interquartile 25% (IQ1) | 1.4% | 1.1% |
| Interquartile 75% (IQ3) | 2.2% | 3.2% |
| Interquartile Range (IQR) | 0.82% | 2.1% |
| Standard Deviation (Sample) | 0.69% | 3.6% |
| Standard Deviation (Population) | 0.67% | 3.5% |
Similar Demographics by Disability Age Under 5
Demographics Similar to Immigrants from Poland by Disability Age Under 5
In terms of disability age under 5, the demographic groups most similar to Immigrants from Poland are Romanian (1.3%, a difference of 0.020%), Nigerian (1.3%, a difference of 0.15%), Immigrants from Europe (1.3%, a difference of 0.16%), Liberian (1.3%, a difference of 0.20%), and Mexican (1.3%, a difference of 0.21%).
| Demographics | Rating | Rank | Disability Age Under 5 |
| Jamaicans | 30.7 /100 | #199 | Fair 1.3% |
| Immigrants | Lithuania | 27.2 /100 | #200 | Fair 1.3% |
| Immigrants | Italy | 25.4 /100 | #201 | Fair 1.3% |
| Arapaho | 24.1 /100 | #202 | Fair 1.3% |
| Liberians | 24.0 /100 | #203 | Fair 1.3% |
| Immigrants | Europe | 23.6 /100 | #204 | Fair 1.3% |
| Romanians | 22.5 /100 | #205 | Fair 1.3% |
| Immigrants | Poland | 22.4 /100 | #206 | Fair 1.3% |
| Nigerians | 21.2 /100 | #207 | Fair 1.3% |
| Mexicans | 20.8 /100 | #208 | Fair 1.3% |
| Bulgarians | 19.5 /100 | #209 | Poor 1.3% |
| Pakistanis | 19.4 /100 | #210 | Poor 1.3% |
| Immigrants | Greece | 19.1 /100 | #211 | Poor 1.3% |
| Chileans | 18.8 /100 | #212 | Poor 1.3% |
| Immigrants | Sudan | 18.7 /100 | #213 | Poor 1.3% |
Demographics Similar to Paraguayans by Disability Age Under 5
In terms of disability age under 5, the demographic groups most similar to Paraguayans are Pennsylvania German (1.9%, a difference of 1.3%), Native/Alaskan (1.9%, a difference of 1.7%), Dutch West Indian (1.9%, a difference of 2.1%), Apache (2.0%, a difference of 2.9%), and Chippewa (1.9%, a difference of 5.1%).
| Demographics | Rating | Rank | Disability Age Under 5 |
| Houma | 0.0 /100 | #329 | Tragic 1.9% |
| Choctaw | 0.0 /100 | #330 | Tragic 1.9% |
| French Canadians | 0.0 /100 | #331 | Tragic 1.9% |
| Chippewa | 0.0 /100 | #332 | Tragic 1.9% |
| Dutch West Indians | 0.0 /100 | #333 | Tragic 1.9% |
| Natives/Alaskans | 0.0 /100 | #334 | Tragic 1.9% |
| Pennsylvania Germans | 0.0 /100 | #335 | Tragic 1.9% |
| Paraguayans | 0.0 /100 | #336 | Tragic 2.0% |
| Apache | 0.0 /100 | #337 | Tragic 2.0% |
| Tohono O'odham | 0.0 /100 | #338 | Tragic 2.2% |
| Immigrants | Azores | 0.0 /100 | #339 | Tragic 2.2% |
| Menominee | 0.0 /100 | #340 | Tragic 2.3% |
| Tsimshian | 0.0 /100 | #341 | Tragic 2.4% |
| Alaska Natives | 0.0 /100 | #342 | Tragic 2.9% |
| Colville | 0.0 /100 | #343 | Tragic 3.3% |