Zip Codes with the Highest Percentage of Population with a Degree in Arts and Humanities in Wyoming
RELATED REPORTS & OPTIONS
Arts and Humanities
Wyoming
Compare Zip Codes
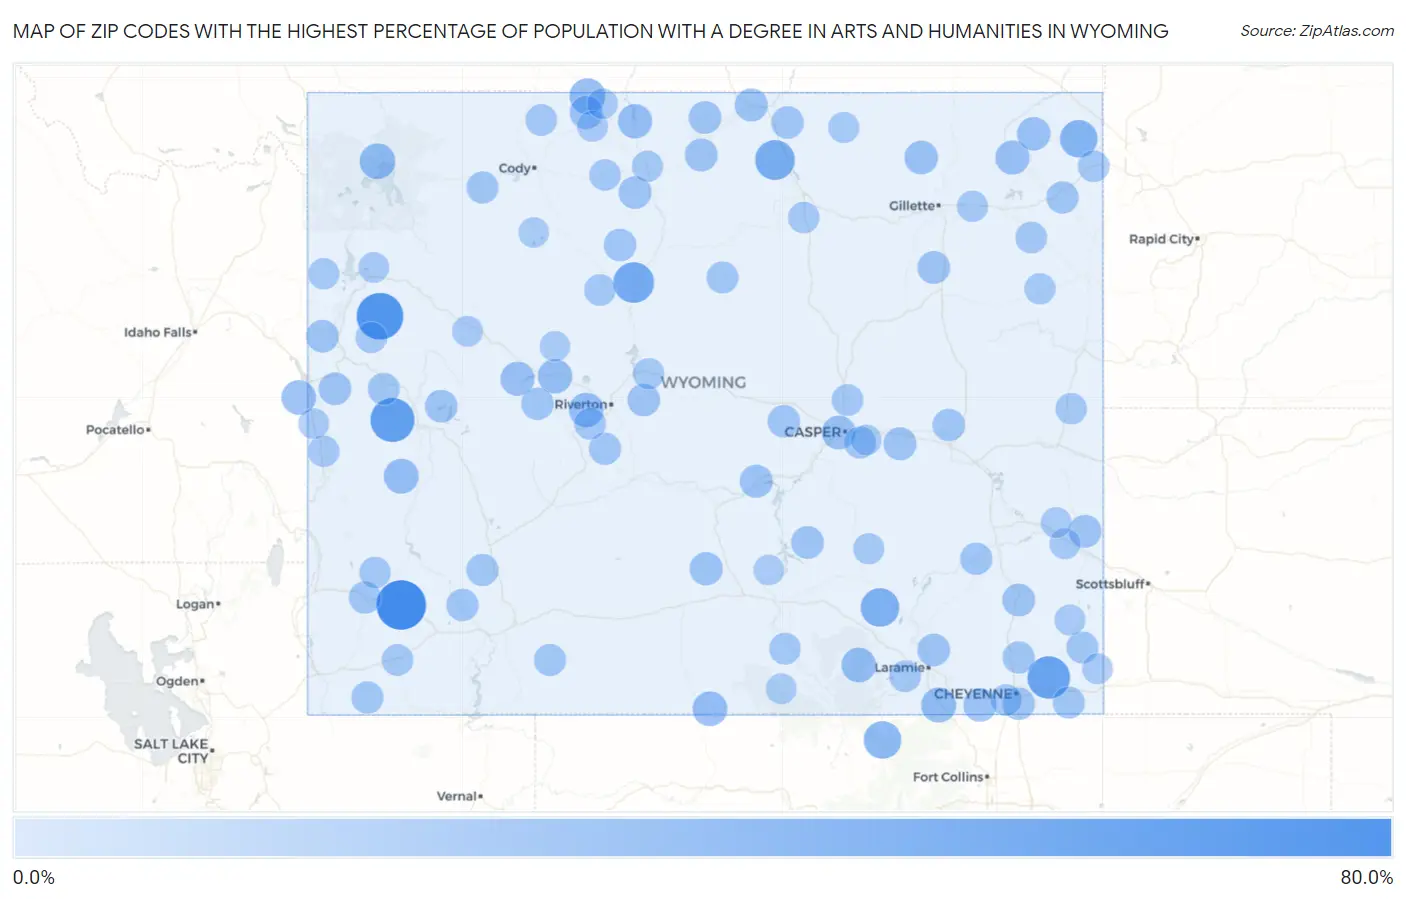
Map of Zip Codes with the Highest Percentage of Population with a Degree in Arts and Humanities in Wyoming
0.0%
80.0%
Zip Codes with the Highest Percentage of Population with a Degree in Arts and Humanities in Wyoming
| Zip Code | % Graduates | vs State | vs National | |
| 1. | 83124 | 75.0% | 6.9%(+68.1)#1 | 6.0%(+69.0)#110 |
| 2. | 83011 | 63.5% | 6.9%(+56.6)#2 | 6.0%(+57.5)#147 |
| 3. | 83115 | 52.9% | 6.9%(+46.0)#3 | 6.0%(+46.9)#188 |
| 4. | 82060 | 47.2% | 6.9%(+40.3)#4 | 6.0%(+41.2)#253 |
| 5. | 82430 | 40.0% | 6.9%(+33.1)#5 | 6.0%(+34.0)#349 |
| 6. | 82842 | 36.6% | 6.9%(+29.7)#6 | 6.0%(+30.6)#429 |
| 7. | 82083 | 31.7% | 6.9%(+24.8)#7 | 6.0%(+25.7)#592 |
| 8. | 82063 | 27.9% | 6.9%(+21.0)#8 | 6.0%(+21.9)#769 |
| 9. | 82710 | 27.5% | 6.9%(+20.6)#9 | 6.0%(+21.5)#791 |
| 10. | 82423 | 21.1% | 6.9%(+14.1)#10 | 6.0%(+15.1)#1,344 |
| 11. | 82190 | 20.6% | 6.9%(+13.7)#11 | 6.0%(+14.6)#1,404 |
| 12. | 82084 | 18.5% | 6.9%(+11.6)#12 | 6.0%(+12.5)#1,726 |
| 13. | 83113 | 17.5% | 6.9%(+10.6)#13 | 6.0%(+11.5)#1,963 |
| 14. | 82055 | 16.8% | 6.9%(+9.86)#14 | 6.0%(+10.8)#2,126 |
| 15. | 82323 | 16.7% | 6.9%(+9.76)#15 | 6.0%(+10.7)#2,167 |
| 16. | 83120 | 16.3% | 6.9%(+9.38)#16 | 6.0%(+10.3)#2,274 |
| 17. | 82510 | 16.2% | 6.9%(+9.31)#17 | 6.0%(+10.2)#2,283 |
| 18. | 82516 | 15.6% | 6.9%(+8.72)#18 | 6.0%(+9.63)#2,449 |
| 19. | 82431 | 15.4% | 6.9%(+8.47)#19 | 6.0%(+9.37)#2,543 |
| 20. | 82721 | 14.6% | 6.9%(+7.73)#20 | 6.0%(+8.64)#2,818 |
| 21. | 82512 | 14.0% | 6.9%(+7.13)#21 | 6.0%(+8.04)#3,117 |
| 22. | 82644 | 13.4% | 6.9%(+6.50)#22 | 6.0%(+7.41)#3,407 |
| 23. | 82716 | 12.5% | 6.9%(+5.60)#23 | 6.0%(+6.50)#3,939 |
| 24. | 82720 | 12.2% | 6.9%(+5.34)#24 | 6.0%(+6.25)#4,147 |
| 25. | 82059 | 11.5% | 6.9%(+4.61)#25 | 6.0%(+5.52)#4,678 |
| 26. | 82301 | 11.0% | 6.9%(+4.10)#26 | 6.0%(+5.01)#5,134 |
| 27. | 82421 | 10.5% | 6.9%(+3.62)#27 | 6.0%(+4.53)#5,613 |
| 28. | 82839 | 10.4% | 6.9%(+3.48)#28 | 6.0%(+4.39)#5,761 |
| 29. | 82620 | 10.3% | 6.9%(+3.44)#29 | 6.0%(+4.35)#5,820 |
| 30. | 82637 | 10.1% | 6.9%(+3.22)#30 | 6.0%(+4.13)#6,082 |
| 31. | 82210 | 9.8% | 6.9%(+2.85)#31 | 6.0%(+3.76)#6,584 |
| 32. | 82718 | 9.5% | 6.9%(+2.58)#32 | 6.0%(+3.49)#6,961 |
| 33. | 82240 | 9.4% | 6.9%(+2.54)#33 | 6.0%(+3.45)#7,013 |
| 34. | 82441 | 9.4% | 6.9%(+2.50)#34 | 6.0%(+3.41)#7,085 |
| 35. | 82327 | 9.3% | 6.9%(+2.40)#35 | 6.0%(+3.31)#7,239 |
| 36. | 82410 | 9.2% | 6.9%(+2.34)#36 | 6.0%(+3.25)#7,336 |
| 37. | 82072 | 9.1% | 6.9%(+2.22)#37 | 6.0%(+3.12)#7,529 |
| 38. | 83128 | 9.1% | 6.9%(+2.21)#38 | 6.0%(+3.12)#7,530 |
| 39. | 82941 | 9.1% | 6.9%(+2.16)#39 | 6.0%(+3.06)#7,663 |
| 40. | 82836 | 8.9% | 6.9%(+2.00)#40 | 6.0%(+2.91)#7,903 |
| 41. | 83014 | 8.8% | 6.9%(+1.93)#41 | 6.0%(+2.84)#8,022 |
| 42. | 82501 | 8.8% | 6.9%(+1.93)#42 | 6.0%(+2.83)#8,024 |
| 43. | 82801 | 8.7% | 6.9%(+1.79)#43 | 6.0%(+2.69)#8,278 |
| 44. | 82007 | 8.7% | 6.9%(+1.76)#44 | 6.0%(+2.66)#8,321 |
| 45. | 82401 | 8.6% | 6.9%(+1.72)#45 | 6.0%(+2.63)#8,393 |
| 46. | 82604 | 8.3% | 6.9%(+1.41)#46 | 6.0%(+2.32)#9,009 |
| 47. | 82514 | 8.2% | 6.9%(+1.34)#47 | 6.0%(+2.25)#9,140 |
| 48. | 82633 | 8.2% | 6.9%(+1.25)#48 | 6.0%(+2.16)#9,337 |
| 49. | 82201 | 7.5% | 6.9%(+0.579)#49 | 6.0%(+1.49)#10,764 |
| 50. | 82520 | 7.4% | 6.9%(+0.513)#50 | 6.0%(+1.42)#10,922 |
| 51. | 82729 | 7.3% | 6.9%(+0.421)#51 | 6.0%(+1.33)#11,152 |
| 52. | 83116 | 7.3% | 6.9%(+0.414)#52 | 6.0%(+1.32)#11,179 |
| 53. | 82935 | 7.3% | 6.9%(+0.377)#53 | 6.0%(+1.28)#11,266 |
| 54. | 82932 | 7.2% | 6.9%(+0.343)#54 | 6.0%(+1.25)#11,356 |
| 55. | 82009 | 7.0% | 6.9%(+0.134)#55 | 6.0%(+1.04)#11,852 |
| 56. | 82414 | 7.0% | 6.9%(+0.131)#56 | 6.0%(+1.04)#11,860 |
| 57. | 82930 | 7.0% | 6.9%(+0.075)#57 | 6.0%(+0.982)#12,019 |
| 58. | 82901 | 6.6% | 6.9%(-0.279)#58 | 6.0%(+0.628)#12,945 |
| 59. | 82922 | 6.6% | 6.9%(-0.299)#59 | 6.0%(+0.608)#12,998 |
| 60. | 82054 | 6.5% | 6.9%(-0.399)#60 | 6.0%(+0.508)#13,257 |
| 61. | 82050 | 6.2% | 6.9%(-0.653)#61 | 6.0%(+0.254)#13,960 |
| 62. | 82609 | 6.2% | 6.9%(-0.691)#62 | 6.0%(+0.216)#14,065 |
| 63. | 82442 | 6.2% | 6.9%(-0.749)#63 | 6.0%(+0.158)#14,235 |
| 64. | 82601 | 5.7% | 6.9%(-1.22)#64 | 6.0%(-0.315)#15,601 |
| 65. | 82435 | 5.4% | 6.9%(-1.51)#65 | 6.0%(-0.607)#16,461 |
| 66. | 82730 | 5.4% | 6.9%(-1.53)#66 | 6.0%(-0.619)#16,493 |
| 67. | 82331 | 5.4% | 6.9%(-1.54)#67 | 6.0%(-0.632)#16,533 |
| 68. | 82515 | 5.4% | 6.9%(-1.55)#68 | 6.0%(-0.638)#16,549 |
| 69. | 82070 | 5.3% | 6.9%(-1.62)#69 | 6.0%(-0.716)#16,785 |
| 70. | 82712 | 5.1% | 6.9%(-1.77)#70 | 6.0%(-0.867)#17,232 |
| 71. | 82443 | 4.8% | 6.9%(-2.09)#71 | 6.0%(-1.18)#18,133 |
| 72. | 82937 | 4.8% | 6.9%(-2.13)#72 | 6.0%(-1.22)#18,241 |
| 73. | 83101 | 4.6% | 6.9%(-2.32)#73 | 6.0%(-1.41)#18,772 |
| 74. | 82001 | 4.6% | 6.9%(-2.32)#74 | 6.0%(-1.41)#18,790 |
| 75. | 82411 | 4.3% | 6.9%(-2.56)#75 | 6.0%(-1.65)#19,430 |
| 76. | 82225 | 4.2% | 6.9%(-2.66)#76 | 6.0%(-1.75)#19,685 |
| 77. | 82834 | 4.2% | 6.9%(-2.71)#77 | 6.0%(-1.81)#19,820 |
| 78. | 83110 | 4.1% | 6.9%(-2.83)#78 | 6.0%(-1.92)#20,137 |
| 79. | 82649 | 3.8% | 6.9%(-3.06)#79 | 6.0%(-2.15)#20,724 |
| 80. | 83001 | 3.6% | 6.9%(-3.26)#80 | 6.0%(-2.35)#21,238 |
| 81. | 82701 | 3.5% | 6.9%(-3.36)#81 | 6.0%(-2.46)#21,510 |
| 82. | 82727 | 3.5% | 6.9%(-3.44)#82 | 6.0%(-2.54)#21,688 |
| 83. | 83414 | 3.2% | 6.9%(-3.72)#83 | 6.0%(-2.81)#22,293 |
| 84. | 82329 | 3.1% | 6.9%(-3.78)#84 | 6.0%(-2.87)#22,429 |
| 85. | 82835 | 3.0% | 6.9%(-3.92)#85 | 6.0%(-3.01)#22,706 |
| 86. | 82426 | 3.0% | 6.9%(-3.95)#86 | 6.0%(-3.04)#22,767 |
| 87. | 82412 | 2.7% | 6.9%(-4.16)#87 | 6.0%(-3.26)#23,147 |
| 88. | 82513 | 2.4% | 6.9%(-4.52)#88 | 6.0%(-3.61)#23,768 |
| 89. | 82223 | 2.2% | 6.9%(-4.66)#89 | 6.0%(-3.75)#23,993 |
| 90. | 82221 | 2.2% | 6.9%(-4.73)#90 | 6.0%(-3.82)#24,087 |
| 91. | 82082 | 1.8% | 6.9%(-5.11)#91 | 6.0%(-4.20)#24,634 |
| 92. | 82212 | 1.7% | 6.9%(-5.19)#92 | 6.0%(-4.28)#24,722 |
| 93. | 83127 | 1.6% | 6.9%(-5.31)#93 | 6.0%(-4.41)#24,866 |
| 94. | 82325 | 1.5% | 6.9%(-5.39)#94 | 6.0%(-4.49)#24,950 |
| 95. | 82636 | 1.4% | 6.9%(-5.53)#95 | 6.0%(-4.62)#25,068 |
| 96. | 83013 | 1.4% | 6.9%(-5.54)#96 | 6.0%(-4.63)#25,077 |
| 97. | 82420 | 1.3% | 6.9%(-5.65)#97 | 6.0%(-4.75)#25,177 |
| 98. | 82334 | 1.2% | 6.9%(-5.68)#98 | 6.0%(-4.78)#25,208 |
| 99. | 82433 | 0.69% | 6.9%(-6.21)#99 | 6.0%(-5.31)#25,589 |
| 100. | 82523 | 0.56% | 6.9%(-6.34)#100 | 6.0%(-5.43)#25,644 |
1
2Common Questions
What are the Top 10 Zip Codes with the Highest Percentage of Population with a Degree in Arts and Humanities in Wyoming?
Top 10 Zip Codes with the Highest Percentage of Population with a Degree in Arts and Humanities in Wyoming are:
What zip code has the Highest Percentage of Population with a Degree in Arts and Humanities in Wyoming?
83124 has the Highest Percentage of Population with a Degree in Arts and Humanities in Wyoming with 75.0%.
What is the Percentage of Population with a Degree in Arts and Humanities in the State of Wyoming?
Percentage of Population with a Degree in Arts and Humanities in Wyoming is 6.9%.
What is the Percentage of Population with a Degree in Arts and Humanities in the United States?
Percentage of Population with a Degree in Arts and Humanities in the United States is 6.0%.