Zip Codes with the Highest Percentage of Population Employed in Farming, Fishing & Forestry in Missouri
RELATED REPORTS & OPTIONS
Farming, Fishing & Forestry
Missouri
Compare Zip Codes
Map of Zip Codes with the Highest Percentage of Population Employed in Farming, Fishing & Forestry in Missouri
0.0%
60.0%
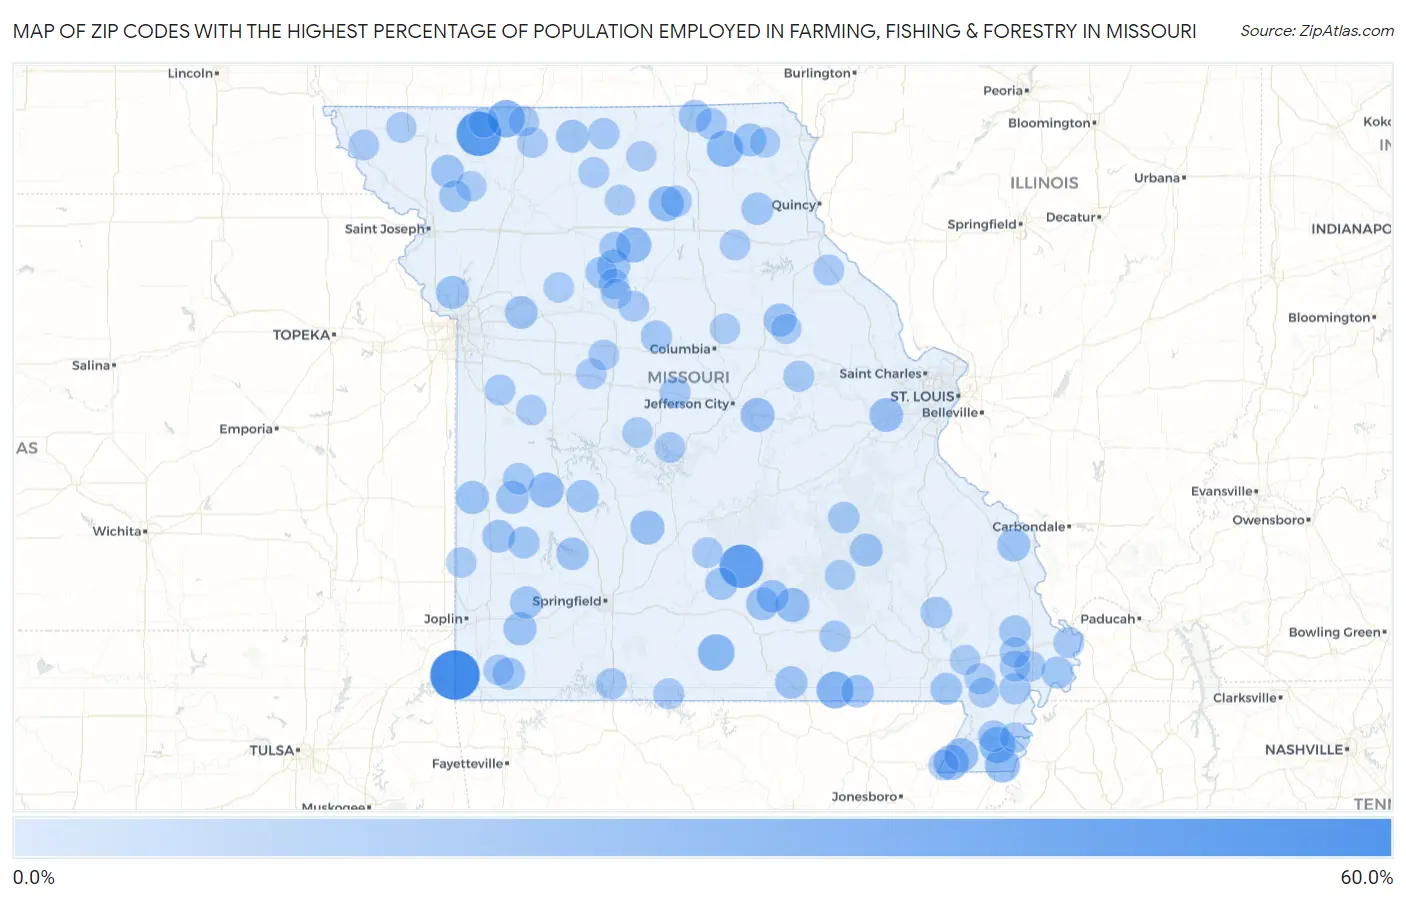
Zip Codes with the Highest Percentage of Population Employed in Farming, Fishing & Forestry in Missouri
| Zip Code | % Employed | vs State | vs National | |
| 1. | 64868 | 58.3% | 0.49% (+57.8)#1 | 0.61% (+57.7)#36 |
| 2. | 64499 | 44.3% | 0.49% (+43.8)#2 | 0.61% (+43.7)#75 |
| 3. | 65570 | 41.5% | 0.49% (+41.0)#3 | 0.61% (+40.9)#91 |
| 4. | 64458 | 24.3% | 0.49% (+23.8)#4 | 0.61% (+23.7)#296 |
| 5. | 65690 | 22.9% | 0.49% (+22.4)#5 | 0.61% (+22.3)#320 |
| 6. | 65638 | 21.8% | 0.49% (+21.3)#6 | 0.61% (+21.2)#351 |
| 7. | 63531 | 20.8% | 0.49% (+20.3)#7 | 0.61% (+20.2)#374 |
| 8. | 63826 | 20.6% | 0.49% (+20.1)#8 | 0.61% (+20.0)#381 |
| 9. | 64676 | 17.9% | 0.49% (+17.4)#9 | 0.61% (+17.3)#483 |
| 10. | 63539 | 17.6% | 0.49% (+17.2)#10 | 0.61% (+17.0)#491 |
| 11. | 63821 | 17.6% | 0.49% (+17.1)#11 | 0.61% (+17.0)#495 |
| 12. | 63839 | 17.5% | 0.49% (+17.0)#12 | 0.61% (+16.9)#507 |
| 13. | 64781 | 17.1% | 0.49% (+16.7)#13 | 0.61% (+16.5)#523 |
| 14. | 65571 | 15.3% | 0.49% (+14.8)#14 | 0.61% (+14.7)#628 |
| 15. | 65783 | 14.9% | 0.49% (+14.4)#15 | 0.61% (+14.3)#652 |
| 16. | 63876 | 14.8% | 0.49% (+14.4)#16 | 0.61% (+14.2)#655 |
| 17. | 65054 | 14.8% | 0.49% (+14.4)#17 | 0.61% (+14.2)#656 |
| 18. | 63039 | 14.1% | 0.49% (+13.6)#18 | 0.61% (+13.5)#709 |
| 19. | 64778 | 12.6% | 0.49% (+12.1)#19 | 0.61% (+12.0)#857 |
| 20. | 64873 | 12.5% | 0.49% (+12.0)#20 | 0.61% (+11.9)#866 |
| 21. | 64164 | 12.3% | 0.49% (+11.8)#21 | 0.61% (+11.7)#900 |
| 22. | 65232 | 12.0% | 0.49% (+11.5)#22 | 0.61% (+11.4)#928 |
| 23. | 63543 | 12.0% | 0.49% (+11.5)#23 | 0.61% (+11.4)#929 |
| 24. | 65286 | 12.0% | 0.49% (+11.5)#24 | 0.61% (+11.4)#931 |
| 25. | 63770 | 11.8% | 0.49% (+11.4)#25 | 0.61% (+11.2)#947 |
| 26. | 64673 | 11.8% | 0.49% (+11.3)#26 | 0.61% (+11.2)#954 |
| 27. | 65464 | 11.8% | 0.49% (+11.3)#27 | 0.61% (+11.2)#956 |
| 28. | 64784 | 11.7% | 0.49% (+11.3)#28 | 0.61% (+11.1)#961 |
| 29. | 63625 | 11.7% | 0.49% (+11.2)#29 | 0.61% (+11.1)#964 |
| 30. | 64017 | 11.5% | 0.49% (+11.0)#30 | 0.61% (+10.9)#992 |
| 31. | 64750 | 11.4% | 0.49% (+10.9)#31 | 0.61% (+10.8)#1,009 |
| 32. | 63548 | 11.2% | 0.49% (+10.7)#32 | 0.61% (+10.6)#1,029 |
| 33. | 65589 | 11.1% | 0.49% (+10.6)#33 | 0.61% (+10.5)#1,040 |
| 34. | 64457 | 10.9% | 0.49% (+10.4)#34 | 0.61% (+10.3)#1,062 |
| 35. | 63942 | 10.9% | 0.49% (+10.4)#35 | 0.61% (+10.3)#1,065 |
| 36. | 65692 | 10.8% | 0.49% (+10.3)#36 | 0.61% (+10.2)#1,072 |
| 37. | 65601 | 10.8% | 0.49% (+10.3)#37 | 0.61% (+10.2)#1,085 |
| 38. | 64848 | 10.5% | 0.49% (+10.0)#38 | 0.61% (+9.90)#1,123 |
| 39. | 65774 | 10.4% | 0.49% (+9.92)#39 | 0.61% (+9.80)#1,139 |
| 40. | 63434 | 10.3% | 0.49% (+9.80)#40 | 0.61% (+9.68)#1,165 |
| 41. | 64861 | 10.2% | 0.49% (+9.75)#41 | 0.61% (+9.63)#1,175 |
| 42. | 65660 | 10.2% | 0.49% (+9.68)#42 | 0.61% (+9.56)#1,186 |
| 43. | 63845 | 9.5% | 0.49% (+9.05)#43 | 0.61% (+8.93)#1,285 |
| 44. | 63784 | 9.1% | 0.49% (+8.60)#44 | 0.61% (+8.49)#1,383 |
| 45. | 63961 | 9.0% | 0.49% (+8.52)#45 | 0.61% (+8.40)#1,402 |
| 46. | 64623 | 8.8% | 0.49% (+8.35)#46 | 0.61% (+8.24)#1,441 |
| 47. | 64756 | 8.7% | 0.49% (+8.24)#47 | 0.61% (+8.12)#1,473 |
| 48. | 64494 | 8.7% | 0.49% (+8.17)#48 | 0.61% (+8.05)#1,489 |
| 49. | 63827 | 8.5% | 0.49% (+7.96)#49 | 0.61% (+7.85)#1,534 |
| 50. | 64780 | 8.4% | 0.49% (+7.90)#50 | 0.61% (+7.79)#1,544 |
| 51. | 65250 | 8.4% | 0.49% (+7.89)#51 | 0.61% (+7.77)#1,546 |
| 52. | 64681 | 8.3% | 0.49% (+7.84)#52 | 0.61% (+7.73)#1,564 |
| 53. | 63944 | 8.3% | 0.49% (+7.80)#53 | 0.61% (+7.68)#1,579 |
| 54. | 63536 | 8.2% | 0.49% (+7.72)#54 | 0.61% (+7.61)#1,603 |
| 55. | 65456 | 8.0% | 0.49% (+7.56)#55 | 0.61% (+7.44)#1,649 |
| 56. | 64667 | 7.9% | 0.49% (+7.38)#56 | 0.61% (+7.27)#1,699 |
| 57. | 63862 | 7.9% | 0.49% (+7.38)#57 | 0.61% (+7.26)#1,700 |
| 58. | 63538 | 7.7% | 0.49% (+7.20)#58 | 0.61% (+7.09)#1,759 |
| 59. | 65588 | 7.6% | 0.49% (+7.15)#59 | 0.61% (+7.04)#1,775 |
| 60. | 65726 | 7.0% | 0.49% (+6.51)#60 | 0.61% (+6.40)#1,974 |
| 61. | 65025 | 6.9% | 0.49% (+6.43)#61 | 0.61% (+6.31)#2,014 |
| 62. | 65069 | 6.8% | 0.49% (+6.26)#62 | 0.61% (+6.15)#2,072 |
| 63. | 63867 | 6.6% | 0.49% (+6.16)#63 | 0.61% (+6.04)#2,116 |
| 64. | 63882 | 6.4% | 0.49% (+5.91)#64 | 0.61% (+5.79)#2,200 |
| 65. | 63822 | 6.4% | 0.49% (+5.87)#65 | 0.61% (+5.76)#2,211 |
| 66. | 64743 | 6.4% | 0.49% (+5.87)#66 | 0.61% (+5.76)#2,213 |
| 67. | 65349 | 6.3% | 0.49% (+5.79)#67 | 0.61% (+5.67)#2,256 |
| 68. | 63441 | 6.2% | 0.49% (+5.72)#68 | 0.61% (+5.61)#2,287 |
| 69. | 65761 | 6.2% | 0.49% (+5.71)#69 | 0.61% (+5.59)#2,293 |
| 70. | 64446 | 6.2% | 0.49% (+5.70)#70 | 0.61% (+5.58)#2,296 |
| 71. | 65337 | 6.1% | 0.49% (+5.61)#71 | 0.61% (+5.50)#2,344 |
| 72. | 65333 | 6.1% | 0.49% (+5.58)#72 | 0.61% (+5.46)#2,360 |
| 73. | 64641 | 6.1% | 0.49% (+5.57)#73 | 0.61% (+5.46)#2,363 |
| 74. | 64481 | 6.0% | 0.49% (+5.50)#74 | 0.61% (+5.38)#2,395 |
| 75. | 63828 | 6.0% | 0.49% (+5.48)#75 | 0.61% (+5.36)#2,405 |
| 76. | 64674 | 5.9% | 0.49% (+5.43)#76 | 0.61% (+5.32)#2,434 |
| 77. | 64442 | 5.8% | 0.49% (+5.34)#77 | 0.61% (+5.22)#2,480 |
| 78. | 63868 | 5.8% | 0.49% (+5.28)#78 | 0.61% (+5.16)#2,508 |
| 79. | 63450 | 5.8% | 0.49% (+5.28)#79 | 0.61% (+5.16)#2,511 |
| 80. | 64867 | 5.7% | 0.49% (+5.22)#80 | 0.61% (+5.11)#2,539 |
| 81. | 65072 | 5.6% | 0.49% (+5.15)#81 | 0.61% (+5.03)#2,577 |
| 82. | 63829 | 5.6% | 0.49% (+5.14)#82 | 0.61% (+5.03)#2,578 |
| 83. | 65470 | 5.5% | 0.49% (+5.05)#83 | 0.61% (+4.94)#2,632 |
| 84. | 64428 | 5.5% | 0.49% (+5.05)#84 | 0.61% (+4.93)#2,637 |
| 85. | 64456 | 5.4% | 0.49% (+4.87)#85 | 0.61% (+4.75)#2,716 |
| 86. | 64769 | 5.3% | 0.49% (+4.84)#86 | 0.61% (+4.73)#2,728 |
| 87. | 65078 | 5.3% | 0.49% (+4.77)#87 | 0.61% (+4.65)#2,766 |
| 88. | 65264 | 5.3% | 0.49% (+4.76)#88 | 0.61% (+4.65)#2,770 |
| 89. | 63936 | 5.2% | 0.49% (+4.70)#89 | 0.61% (+4.58)#2,800 |
| 90. | 64668 | 5.2% | 0.49% (+4.69)#90 | 0.61% (+4.58)#2,801 |
| 91. | 64463 | 5.2% | 0.49% (+4.69)#91 | 0.61% (+4.57)#2,809 |
| 92. | 64639 | 5.2% | 0.49% (+4.68)#92 | 0.61% (+4.57)#2,814 |
| 93. | 63851 | 5.2% | 0.49% (+4.68)#93 | 0.61% (+4.56)#2,818 |
| 94. | 65255 | 5.1% | 0.49% (+4.61)#94 | 0.61% (+4.50)#2,859 |
| 95. | 63629 | 5.0% | 0.49% (+4.49)#95 | 0.61% (+4.38)#2,939 |
| 96. | 63474 | 5.0% | 0.49% (+4.47)#96 | 0.61% (+4.35)#2,952 |
| 97. | 64726 | 5.0% | 0.49% (+4.47)#97 | 0.61% (+4.35)#2,953 |
| 98. | 63545 | 4.9% | 0.49% (+4.40)#98 | 0.61% (+4.29)#3,003 |
| 99. | 65344 | 4.9% | 0.49% (+4.39)#99 | 0.61% (+4.27)#3,017 |
| 100. | 63863 | 4.9% | 0.49% (+4.39)#100 | 0.61% (+4.27)#3,019 |
Common Questions
What are the Top 10 Zip Codes with the Highest Percentage of Population Employed in Farming, Fishing & Forestry in Missouri?
Top 10 Zip Codes with the Highest Percentage of Population Employed in Farming, Fishing & Forestry in Missouri are:
What zip code has the Highest Percentage of Population Employed in Farming, Fishing & Forestry in Missouri?
64868 has the Highest Percentage of Population Employed in Farming, Fishing & Forestry in Missouri with 58.3%.
What is the Percentage of Population Employed in Farming, Fishing & Forestry in the State of Missouri?
Percentage of Population Employed in Farming, Fishing & Forestry in Missouri is 0.49%.
What is the Percentage of Population Employed in Farming, Fishing & Forestry in the United States?
Percentage of Population Employed in Farming, Fishing & Forestry in the United States is 0.61%.