Area Code 307 Map & Demographics
Area Code 307 Map
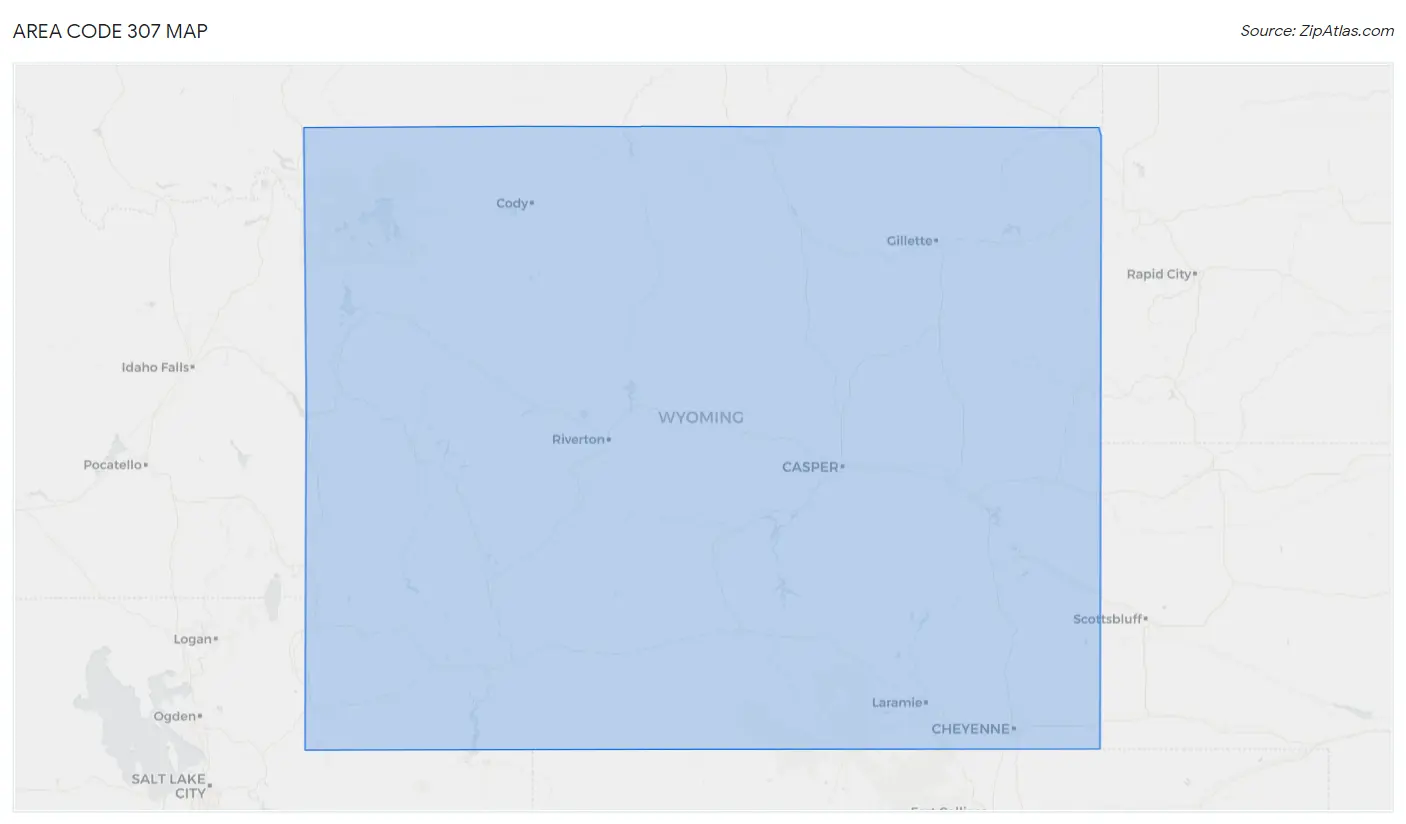
Area Code 307 Overview
$41,764
PER CAPITA INCOME
$90,545
AVG FAMILY INCOME
$76,105
AVG HOUSEHOLD INCOME
41.3%
WAGE / INCOME GAP [ % ]
58.7¢/ $1
WAGE / INCOME GAP [ $ ]
$10,022
FAMILY INCOME DEFICIT
58.01
INEQUALITY / GINI INDEX
577,977
TOTAL POPULATION
295,823
MALE POPULATION
282,154
FEMALE POPULATION
104.84
MALES / 100 FEMALES
95.38
FEMALES / 100 MALES
44.8
MEDIAN AGE
2.9
AVG FAMILY SIZE
2.5
AVG HOUSEHOLD SIZE
294,992
LABOR FORCE [ PEOPLE ]
64.0%
PERCENT IN LABOR FORCE
7.2%
UNEMPLOYMENT RATE
Income in Area Code 307
Income Overview in Area Code 307
Per Capita Income in Area Code 307 is $41,764, while median incomes of families and households are $90,545 and $76,105 respectively.
| Characteristic | Number | Measure |
| Per Capita Income | 577,977 | $41,764 |
| Median Family Income | 147,530 | $90,545 |
| Mean Family Income | 147,530 | $14,907,962 |
| Median Household Income | 234,155 | $76,105 |
| Mean Household Income | 234,155 | $14,413,938 |
| Income Deficit | 147,530 | $10,022 |
| Wage / Income Gap (%) | 577,977 | 41.28% |
| Wage / Income Gap ($) | 577,977 | 58.72¢ per $1 |
| Gini / Inequality Index | 577,977 | 58.01 |
Earnings by Sex in Area Code 307
Average Earnings in Area Code 307 are $42,217, $55,875 for men and $30,193 for women, a difference of 46.0%.
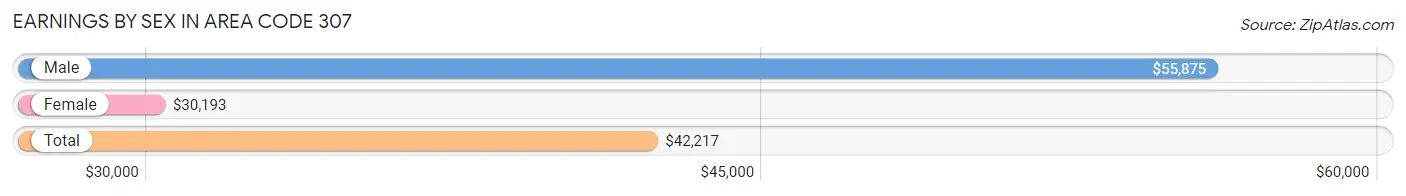
| Sex | Number | Average Earnings |
| Male | 177,395 (54.8%) | $55,875 |
| Female | 146,195 (45.2%) | $30,193 |
| Total | 323,590 (100.0%) | $42,217 |
Earnings by Sex by Income Bracket in Area Code 307
The most common earnings brackets in Area Code 307 are $100,000+ for men (30,766 | 17.3%) and $25,000 to $29,999 for women (11,142 | 7.6%).
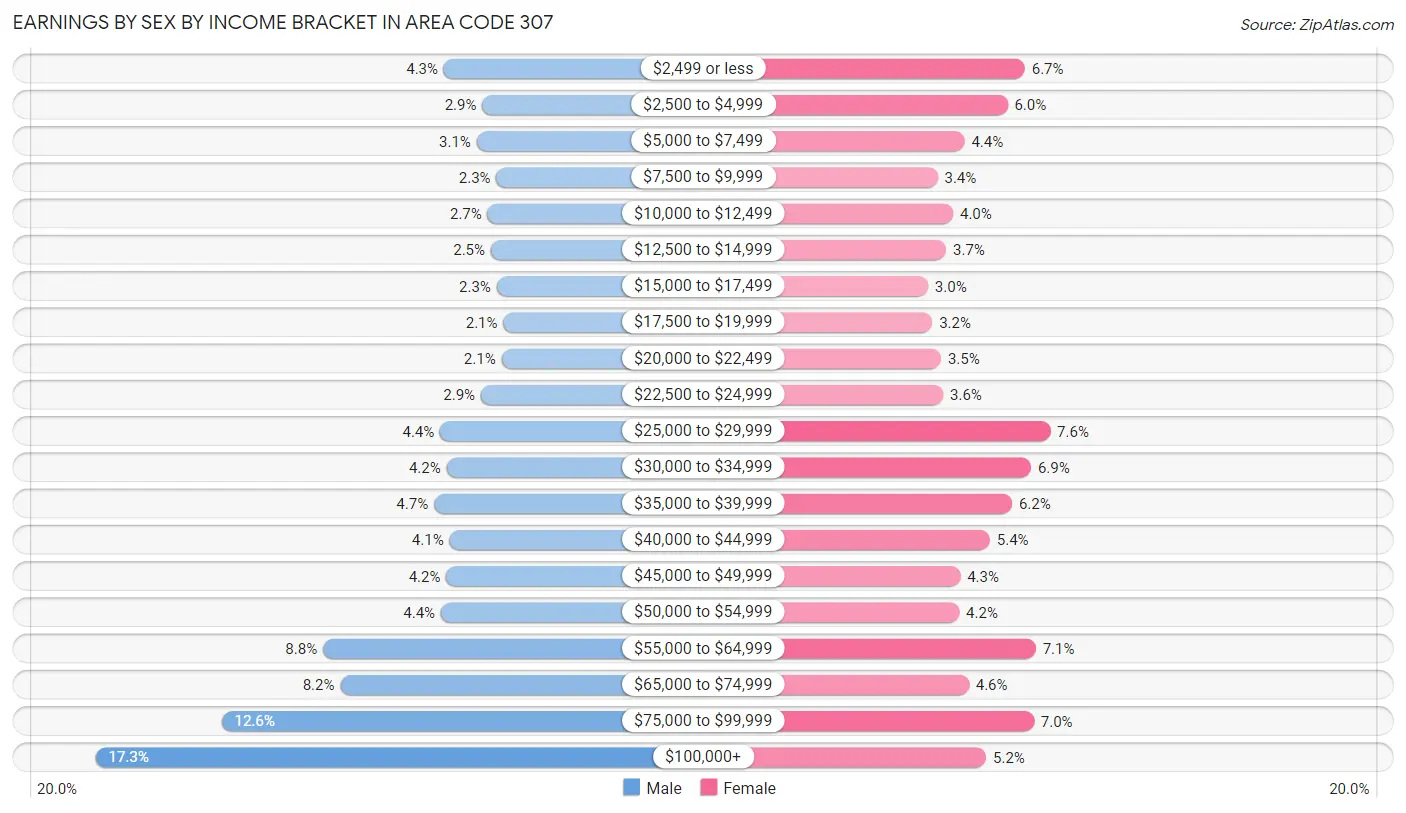
| Income | Male | Female |
| $2,499 or less | 7,609 (4.3%) | 9,749 (6.7%) |
| $2,500 to $4,999 | 5,050 (2.9%) | 8,796 (6.0%) |
| $5,000 to $7,499 | 5,424 (3.1%) | 6,448 (4.4%) |
| $7,500 to $9,999 | 4,109 (2.3%) | 4,970 (3.4%) |
| $10,000 to $12,499 | 4,694 (2.6%) | 5,823 (4.0%) |
| $12,500 to $14,999 | 4,491 (2.5%) | 5,434 (3.7%) |
| $15,000 to $17,499 | 4,095 (2.3%) | 4,450 (3.0%) |
| $17,500 to $19,999 | 3,660 (2.1%) | 4,674 (3.2%) |
| $20,000 to $22,499 | 3,779 (2.1%) | 5,154 (3.5%) |
| $22,500 to $24,999 | 5,136 (2.9%) | 5,279 (3.6%) |
| $25,000 to $29,999 | 7,851 (4.4%) | 11,142 (7.6%) |
| $30,000 to $34,999 | 7,438 (4.2%) | 10,083 (6.9%) |
| $35,000 to $39,999 | 8,270 (4.7%) | 9,053 (6.2%) |
| $40,000 to $44,999 | 7,229 (4.1%) | 7,842 (5.4%) |
| $45,000 to $49,999 | 7,457 (4.2%) | 6,218 (4.3%) |
| $50,000 to $54,999 | 7,809 (4.4%) | 6,152 (4.2%) |
| $55,000 to $64,999 | 15,641 (8.8%) | 10,351 (7.1%) |
| $65,000 to $74,999 | 14,492 (8.2%) | 6,687 (4.6%) |
| $75,000 to $99,999 | 22,395 (12.6%) | 10,252 (7.0%) |
| $100,000+ | 30,766 (17.3%) | 7,638 (5.2%) |
| Total | 177,395 (100.0%) | 146,195 (100.0%) |
Earnings by Sex by Educational Attainment in Area Code 307
Average earnings in Area Code 307 are $7,439,137 for men and $3,781,965 for women, a difference of 49.2%. Men with an educational attainment of college or associate's degree enjoy the highest average annual earnings of $5,983,055, while those with less than high school education earn the least with $1,758,897. Women with an educational attainment of graduate degree earn the most with the average annual earnings of $3,010,151, while those with less than high school education have the smallest earnings of $612,362.
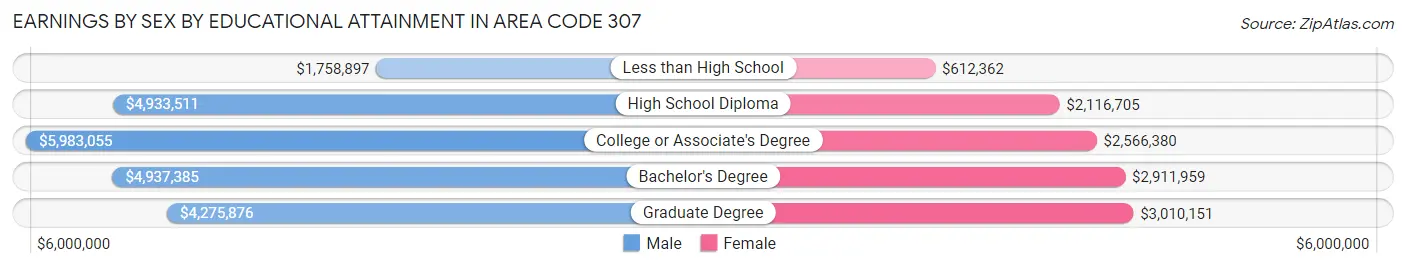
| Educational Attainment | Male Income | Female Income |
| Less than High School | $1,758,897 | $612,362 |
| High School Diploma | $4,933,511 | $2,116,705 |
| College or Associate's Degree | $5,983,055 | $2,566,380 |
| Bachelor's Degree | $4,937,385 | $2,911,959 |
| Graduate Degree | $4,275,876 | $3,010,151 |
| Total | $7,439,137 | $3,781,965 |
Family Income in Area Code 307
Family Income Brackets in Area Code 307
According to the Area Code 307 family income data, there are 5,270,509 families falling into the $100,000 to $149,999 income range, which is the most common income bracket and makes up 3,572.5% of all families. Conversely, the $10,000 to $14,999 income bracket is the least frequent group with only 455,425 families (308.7%) belonging to this category.
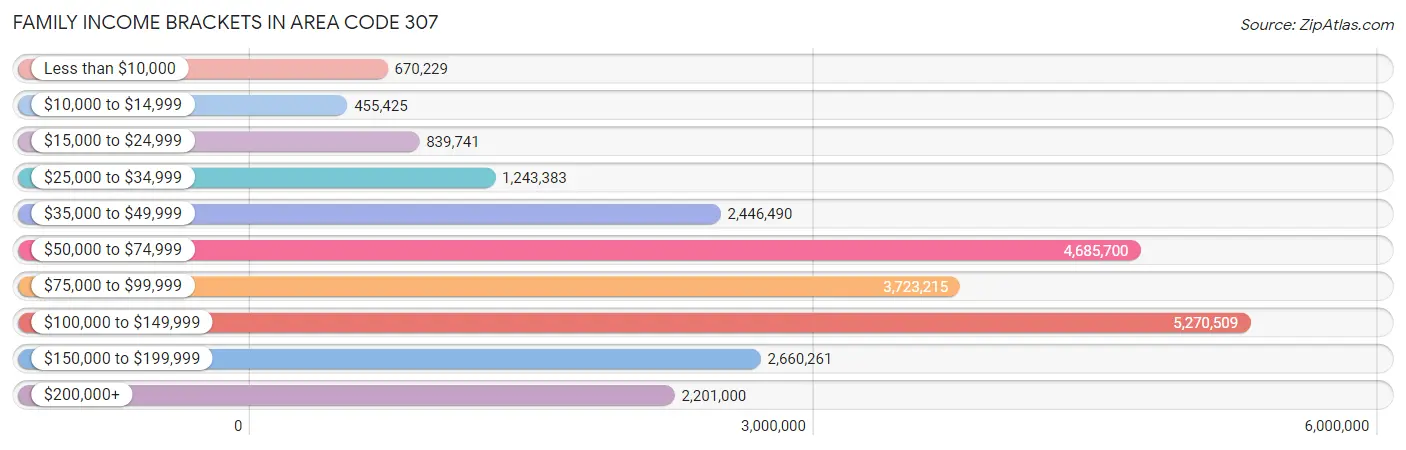
| Income Bracket | # Families | % Families |
| Less than $10,000 | 670,229 | 454.3% |
| $10,000 to $14,999 | 455,425 | 308.7% |
| $15,000 to $24,999 | 839,741 | 569.2% |
| $25,000 to $34,999 | 1,243,383 | 842.8% |
| $35,000 to $49,999 | 2,446,490 | 1,658.3% |
| $50,000 to $74,999 | 4,685,700 | 3,176.1% |
| $75,000 to $99,999 | 3,723,215 | 2,523.7% |
| $100,000 to $149,999 | 5,270,509 | 3,572.5% |
| $150,000 to $199,999 | 2,660,261 | 1,803.2% |
| $200,000+ | 2,201,000 | 1,491.9% |
Family Income by Famaliy Size in Area Code 307
7+ person families (2,425 | 1.6%) account for the highest median family income in Area Code 307 with $116,333 per family, while 2-person families (77,000 | 52.2%) have the highest median income of $40,453 per family member.
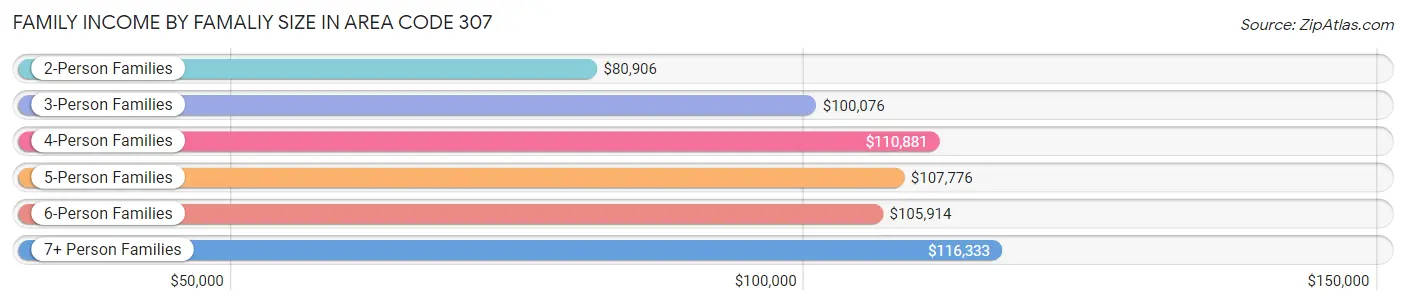
| Income Bracket | # Families | Median Income |
| 2-Person Families | 77,000 (52.2%) | $80,906 |
| 3-Person Families | 29,553 (20.0%) | $100,076 |
| 4-Person Families | 23,491 (15.9%) | $110,881 |
| 5-Person Families | 11,158 (7.6%) | $107,776 |
| 6-Person Families | 3,903 (2.6%) | $105,914 |
| 7+ Person Families | 2,425 (1.6%) | $116,333 |
| Total | 147,530 (100.0%) | $90,545 |
Family Income by Number of Earners in Area Code 307
The median family income in Area Code 307 is $90,545, with families comprising 3+ earners (14,376) having the highest median family income of $133,806, while families with no earners (21,009) have the lowest median family income of $59,433, accounting for 9.7% and 14.2% of families, respectively.
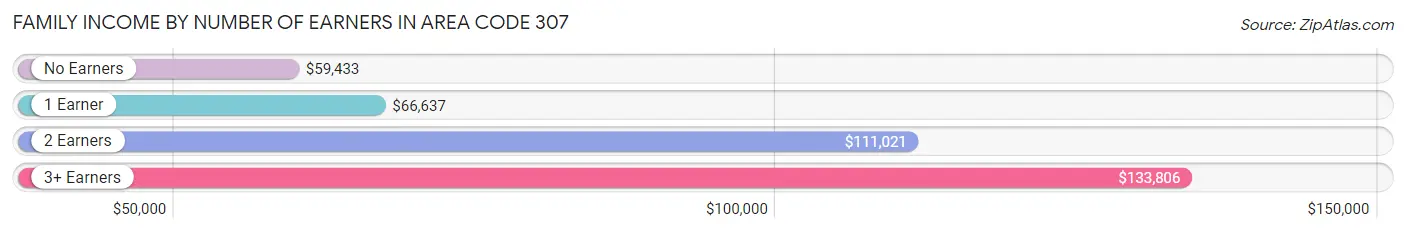
| Number of Earners | # Families | Median Income |
| No Earners | 21,009 (14.2%) | $59,433 |
| 1 Earner | 44,466 (30.1%) | $66,637 |
| 2 Earners | 67,679 (45.9%) | $111,021 |
| 3+ Earners | 14,376 (9.7%) | $133,806 |
| Total | 147,530 (100.0%) | $90,545 |
Household Income in Area Code 307
Household Income Brackets in Area Code 307
With 7,628,536 households falling in the category, the $50,000 to $74,999 income range is the most frequent in Area Code 307, accounting for 3,257.9% of all households. In contrast, only 1,555,258 households (664.2%) fall into the $10,000 to $14,999 income bracket, making it the least populous group.
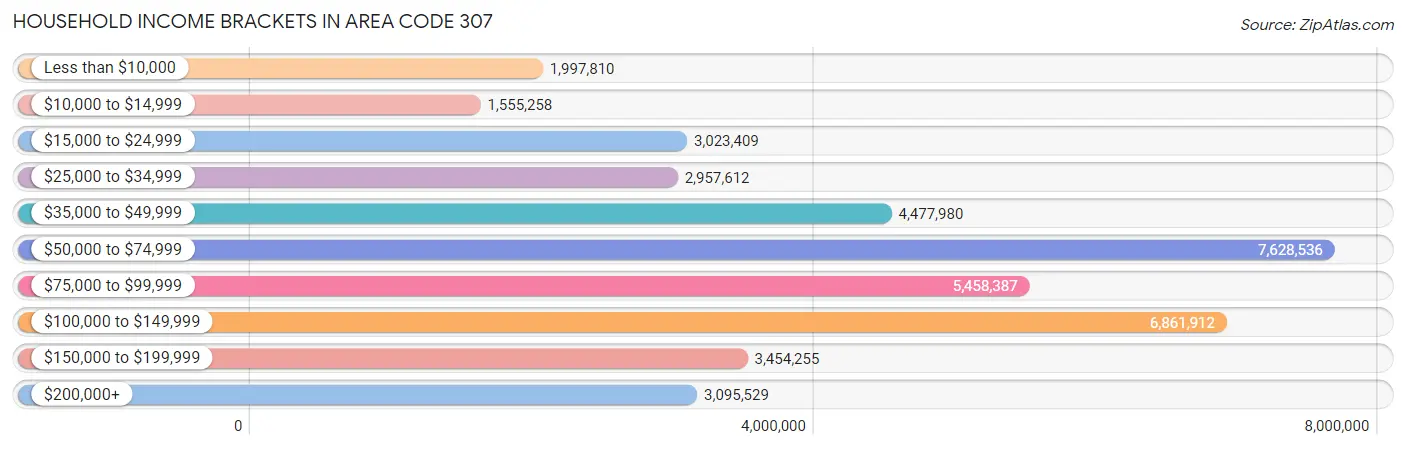
| Income Bracket | # Households | % Households |
| Less than $10,000 | 1,997,810 | 853.2% |
| $10,000 to $14,999 | 1,555,258 | 664.2% |
| $15,000 to $24,999 | 3,023,409 | 1,291.2% |
| $25,000 to $34,999 | 2,957,612 | 1,263.1% |
| $35,000 to $49,999 | 4,477,980 | 1,912.4% |
| $50,000 to $74,999 | 7,628,536 | 3,257.9% |
| $75,000 to $99,999 | 5,458,387 | 2,331.1% |
| $100,000 to $149,999 | 6,861,912 | 2,930.5% |
| $150,000 to $199,999 | 3,454,255 | 1,475.2% |
| $200,000+ | 3,095,529 | 1,322.0% |
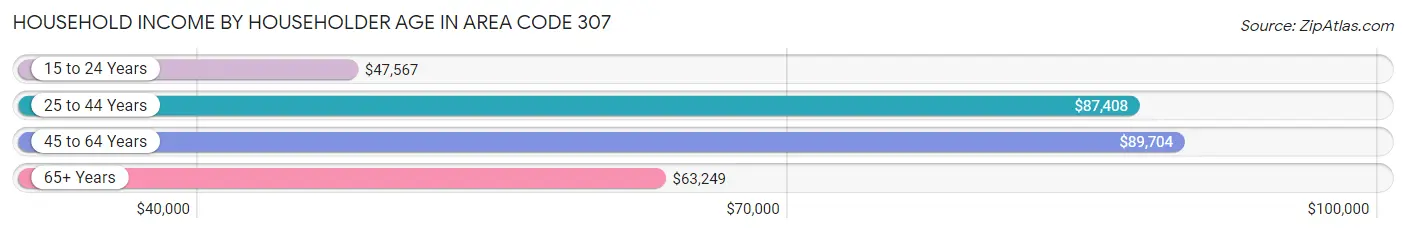
Household Income by Householder Age in Area Code 307
The median household income in Area Code 307 is $76,105, with the highest median household income of $89,704 found in the 45 to 64 years age bracket for the primary householder. A total of 80,856 households (34.5%) fall into this category. Meanwhile, the 15 to 24 years age bracket for the primary householder has the lowest median household income of $47,567, with 13,267 households (5.7%) in this group.
| Income Bracket | # Households | Median Income |
| 15 to 24 Years | 13,267 (5.7%) | $47,567 |
| 25 to 44 Years | 75,549 (32.3%) | $87,408 |
| 45 to 64 Years | 80,856 (34.5%) | $89,704 |
| 65+ Years | 64,483 (27.5%) | $63,249 |
| Total | 234,155 (100.0%) | $76,105 |
Poverty in Area Code 307
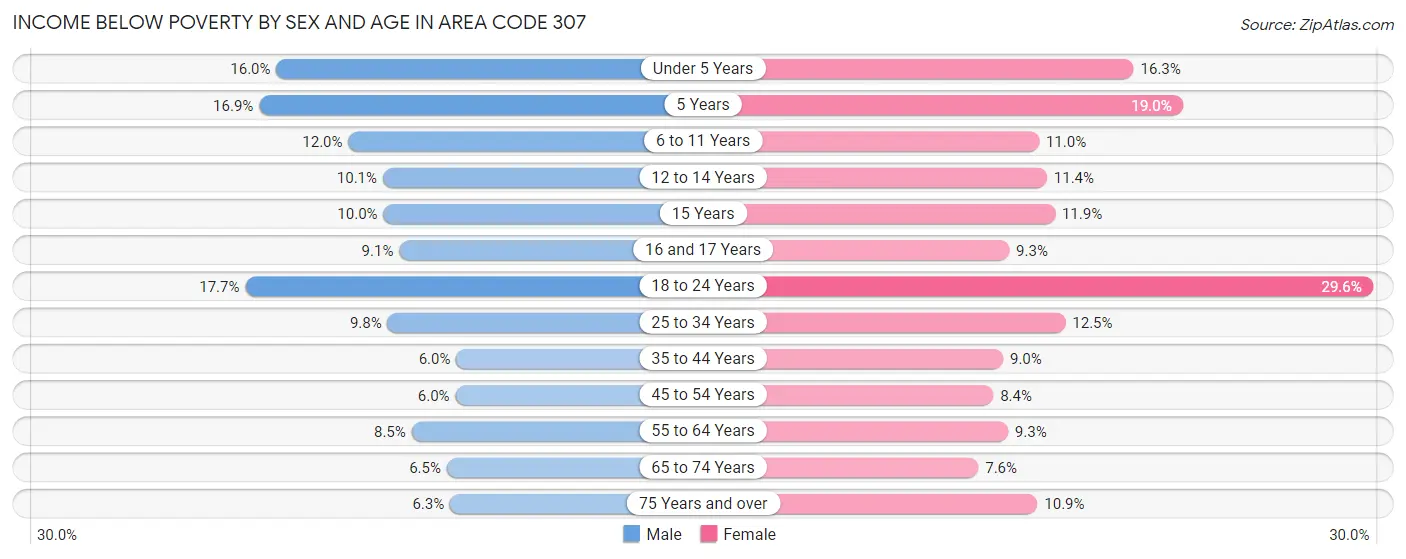
Income Below Poverty by Sex and Age in Area Code 307
With 9.4% poverty level for males and 11.9% for females among the residents of Area Code 307, 18 to 24 year old males and 18 to 24 year old females are the most vulnerable to poverty, with 4,522 males (17.7%) and 6,794 females (29.6%) in their respective age groups living below the poverty level.
| Age Bracket | Male | Female |
| Under 5 Years | 2,620 (16.0%) | 2,545 (16.3%) |
| 5 Years | 619 (16.9%) | 628 (19.0%) |
| 6 to 11 Years | 2,705 (12.0%) | 2,377 (11.0%) |
| 12 to 14 Years | 1,218 (10.1%) | 1,304 (11.4%) |
| 15 Years | 383 (10.0%) | 503 (11.9%) |
| 16 and 17 Years | 734 (9.1%) | 637 (9.3%) |
| 18 to 24 Years | 4,522 (17.7%) | 6,794 (29.6%) |
| 25 to 34 Years | 3,702 (9.8%) | 4,342 (12.4%) |
| 35 to 44 Years | 2,302 (6.0%) | 3,256 (9.0%) |
| 45 to 54 Years | 2,025 (6.0%) | 2,620 (8.4%) |
| 55 to 64 Years | 3,187 (8.5%) | 3,477 (9.2%) |
| 65 to 74 Years | 2,049 (6.5%) | 2,324 (7.6%) |
| 75 Years and over | 1,033 (6.3%) | 2,154 (10.9%) |
| Total | 27,099 (9.4%) | 32,961 (11.9%) |
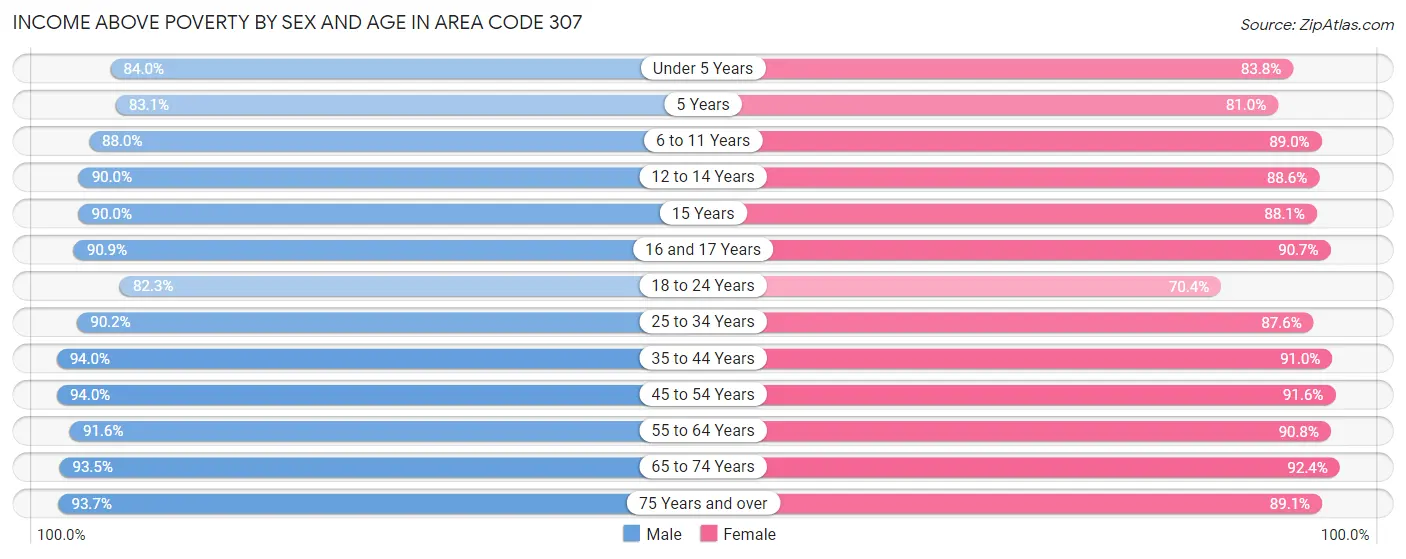
Income Above Poverty by Sex and Age in Area Code 307
According to the poverty statistics in Area Code 307, males aged 35 to 44 years and females aged 65 to 74 years are the age groups that are most secure financially, with 94.0% of males and 92.4% of females in these age groups living above the poverty line.
| Age Bracket | Male | Female |
| Under 5 Years | 13,773 (84.0%) | 13,119 (83.8%) |
| 5 Years | 3,034 (83.1%) | 2,672 (81.0%) |
| 6 to 11 Years | 19,892 (88.0%) | 19,273 (89.0%) |
| 12 to 14 Years | 10,898 (89.9%) | 10,119 (88.6%) |
| 15 Years | 3,441 (90.0%) | 3,734 (88.1%) |
| 16 and 17 Years | 7,301 (90.9%) | 6,196 (90.7%) |
| 18 to 24 Years | 21,006 (82.3%) | 16,149 (70.4%) |
| 25 to 34 Years | 34,129 (90.2%) | 30,527 (87.5%) |
| 35 to 44 Years | 36,295 (94.0%) | 32,999 (91.0%) |
| 45 to 54 Years | 31,660 (94.0%) | 28,463 (91.6%) |
| 55 to 64 Years | 34,542 (91.5%) | 34,112 (90.7%) |
| 65 to 74 Years | 29,521 (93.5%) | 28,270 (92.4%) |
| 75 Years and over | 15,337 (93.7%) | 17,631 (89.1%) |
| Total | 260,829 (90.6%) | 243,264 (88.1%) |
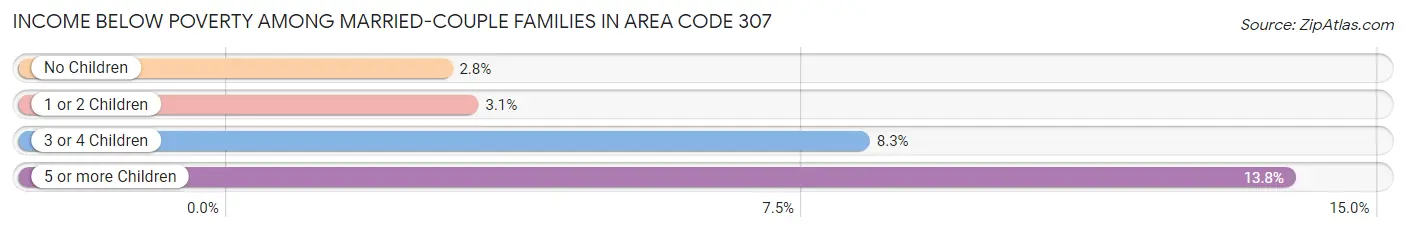
Income Below Poverty Among Married-Couple Families in Area Code 307
The poverty statistics for married-couple families in Area Code 307 show that 3.6% or 4,238 of the total 118,835 families live below the poverty line. Families with 5 or more children have the highest poverty rate of 13.8%, comprising of 225 families. On the other hand, families with no children have the lowest poverty rate of 2.8%, which includes 1,993 families.
| Children | Above Poverty | Below Poverty |
| No Children | 69,107 (97.2%) | 1,993 (2.8%) |
| 1 or 2 Children | 33,816 (96.9%) | 1,096 (3.1%) |
| 3 or 4 Children | 10,270 (91.7%) | 924 (8.3%) |
| 5 or more Children | 1,404 (86.2%) | 225 (13.8%) |
| Total | 114,597 (96.4%) | 4,238 (3.6%) |
Income Below Poverty Among Single-Parent Households in Area Code 307
According to the poverty data in Area Code 307, 13.5% or 1,407 single-father households and 24.1% or 4,402 single-mother households are living below the poverty line. Among single-father households, those with 5 or more children have the highest poverty rate, with 23 households (53.5%) experiencing poverty. Likewise, among single-mother households, those with 3 or 4 children have the highest poverty rate, with 794 households (49.2%) falling below the poverty line.
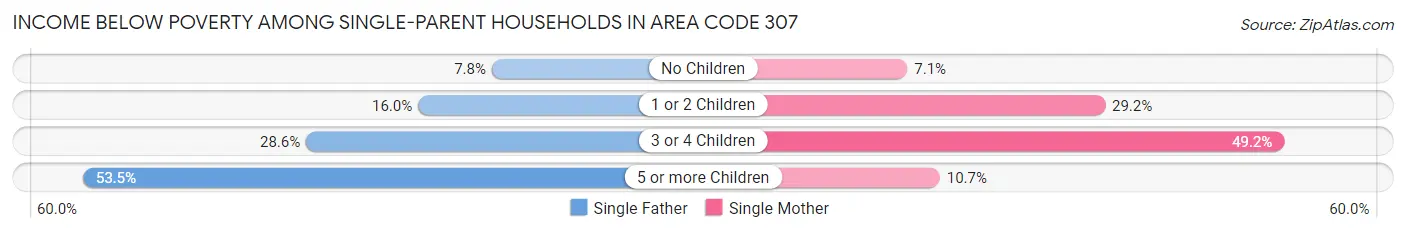
| Children | Single Father | Single Mother |
| No Children | 335 (7.8%) | 396 (7.1%) |
| 1 or 2 Children | 888 (16.0%) | 3,199 (29.2%) |
| 3 or 4 Children | 161 (28.5%) | 794 (49.2%) |
| 5 or more Children | 23 (53.5%) | 13 (10.7%) |
| Total | 1,407 (13.5%) | 4,402 (24.1%) |
Income Below Poverty Among Married-Couple vs Single-Parent Households in Area Code 307
The poverty data for Area Code 307 shows that 4,238 of the married-couple family households (3.6%) and 5,809 of the single-parent households (20.2%) are living below the poverty level. Within the married-couple family households, those with 5 or more children have the highest poverty rate, with 225 households (13.8%) falling below the poverty line. Among the single-parent households, those with 3 or 4 children have the highest poverty rate, with 955 household (43.9%) living below poverty.
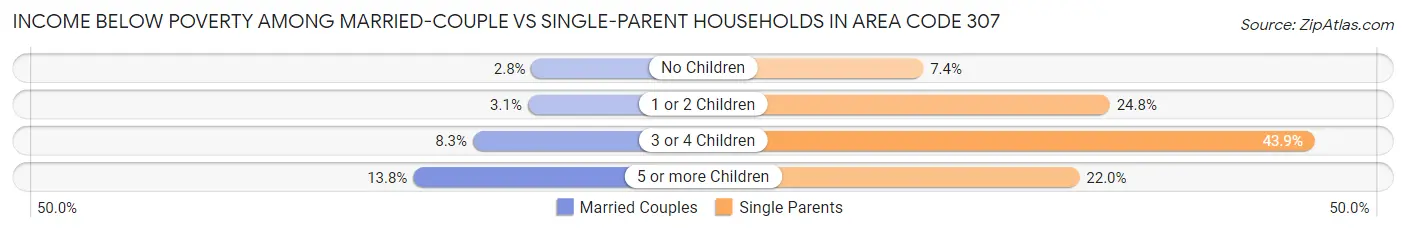
| Children | Married-Couple Families | Single-Parent Households |
| No Children | 1,993 (2.8%) | 731 (7.4%) |
| 1 or 2 Children | 1,096 (3.1%) | 4,087 (24.8%) |
| 3 or 4 Children | 924 (8.3%) | 955 (43.9%) |
| 5 or more Children | 225 (13.8%) | 36 (22.0%) |
| Total | 4,238 (3.6%) | 5,809 (20.2%) |
Race in Area Code 307
The most populous races in Area Code 307 are White / Caucasian (504,839 | 87.4%), Hispanic or Latino (60,473 | 10.5%), and Two or more Races (33,975 | 5.9%).
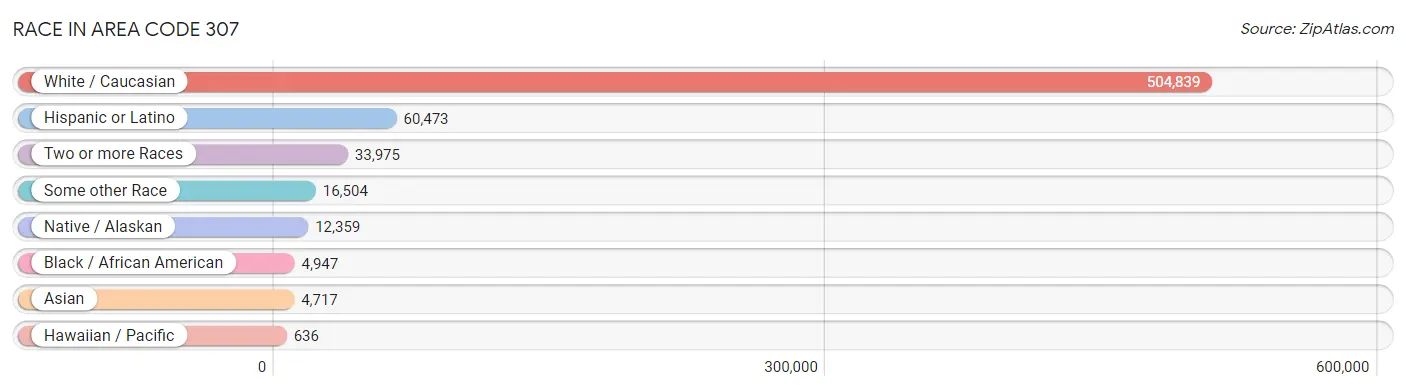
| Race | # Population | % Population |
| Asian | 4,717 | 0.8% |
| Black / African American | 4,947 | 0.9% |
| Hawaiian / Pacific | 636 | 0.1% |
| Hispanic or Latino | 60,473 | 10.5% |
| Native / Alaskan | 12,359 | 2.1% |
| White / Caucasian | 504,839 | 87.4% |
| Two or more Races | 33,975 | 5.9% |
| Some other Race | 16,504 | 2.9% |
| Total | 577,977 | 100.0% |
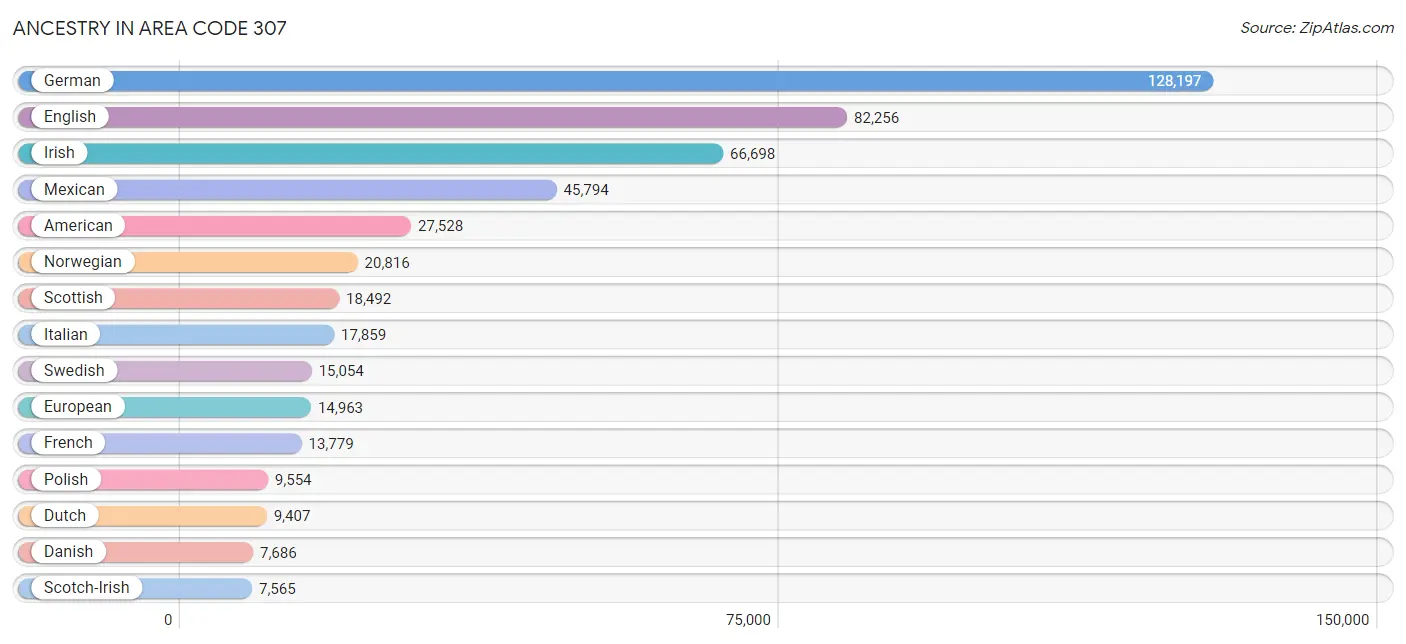
Ancestry in Area Code 307
The most populous ancestries reported in Area Code 307 are German (128,197 | 22.2%), English (82,256 | 14.2%), Irish (66,698 | 11.5%), Mexican (45,794 | 7.9%), and American (27,528 | 4.8%), together accounting for 60.6% of all Area Code 307 residents.
| Ancestry | # Population | % Population |
| African | 467 | 0.1% |
| Alaska Native | 15 | 0.0% |
| Alaskan Athabascan | 8 | 0.0% |
| Albanian | 60 | 0.0% |
| Aleut | 11 | 0.0% |
| American | 27,528 | 4.8% |
| Apache | 854 | 0.2% |
| Arab | 560 | 0.1% |
| Arapaho | 4,917 | 0.9% |
| Argentinean | 68 | 0.0% |
| Armenian | 123 | 0.0% |
| Australian | 124 | 0.0% |
| Austrian | 1,563 | 0.3% |
| Bahamian | 21 | 0.0% |
| Bangladeshi | 7 | 0.0% |
| Barbadian | 42 | 0.0% |
| Basque | 676 | 0.1% |
| Belgian | 1,512 | 0.3% |
| Belizean | 73 | 0.0% |
| Bhutanese | 1,663 | 0.3% |
| Blackfeet | 298 | 0.1% |
| Bolivian | 37 | 0.0% |
| Brazilian | 18 | 0.0% |
| British | 4,575 | 0.8% |
| Bulgarian | 21 | 0.0% |
| Burmese | 913 | 0.2% |
| Cajun | 123 | 0.0% |
| Canadian | 1,436 | 0.3% |
| Celtic | 124 | 0.0% |
| Central American | 1,010 | 0.2% |
| Central American Indian | 288 | 0.1% |
| Cherokee | 1,889 | 0.3% |
| Cheyenne | 383 | 0.1% |
| Chickasaw | 36 | 0.0% |
| Chilean | 149 | 0.0% |
| Chinese | 55 | 0.0% |
| Chippewa | 445 | 0.1% |
| Choctaw | 423 | 0.1% |
| Colombian | 579 | 0.1% |
| Colville | 11 | 0.0% |
| Comanche | 48 | 0.0% |
| Costa Rican | 28 | 0.0% |
| Cree | 130 | 0.0% |
| Creek | 165 | 0.0% |
| Croatian | 629 | 0.1% |
| Crow | 282 | 0.1% |
| Cuban | 342 | 0.1% |
| Czech | 3,091 | 0.5% |
| Czechoslovakian | 481 | 0.1% |
| Danish | 7,686 | 1.3% |
| Dominican | 52 | 0.0% |
| Dutch | 9,407 | 1.6% |
| Dutch West Indian | 7 | 0.0% |
| Eastern European | 1,187 | 0.2% |
| Ecuadorian | 49 | 0.0% |
| Egyptian | 49 | 0.0% |
| English | 82,256 | 14.2% |
| Estonian | 69 | 0.0% |
| Ethiopian | 23 | 0.0% |
| European | 14,963 | 2.6% |
| Filipino | 80 | 0.0% |
| Finnish | 2,039 | 0.4% |
| French | 13,779 | 2.4% |
| French American Indian | 43 | 0.0% |
| French Canadian | 2,724 | 0.5% |
| German | 128,197 | 22.2% |
| German Russian | 74 | 0.0% |
| Ghanaian | 62 | 0.0% |
| Greek | 1,752 | 0.3% |
| Guamanian / Chamorro | 180 | 0.0% |
| Guatemalan | 533 | 0.1% |
| Haitian | 15 | 0.0% |
| Honduran | 41 | 0.0% |
| Hopi | 52 | 0.0% |
| Hungarian | 1,388 | 0.2% |
| Icelander | 220 | 0.0% |
| Indian (Asian) | 1,800 | 0.3% |
| Indonesian | 10 | 0.0% |
| Inupiat | 32 | 0.0% |
| Iranian | 88 | 0.0% |
| Irish | 66,698 | 11.5% |
| Iroquois | 74 | 0.0% |
| Israeli | 21 | 0.0% |
| Italian | 17,859 | 3.1% |
| Jamaican | 98 | 0.0% |
| Japanese | 13 | 0.0% |
| Jordanian | 15 | 0.0% |
| Kenyan | 148 | 0.0% |
| Korean | 2,222 | 0.4% |
| Laotian | 31 | 0.0% |
| Latvian | 258 | 0.0% |
| Lebanese | 130 | 0.0% |
| Liberian | 82 | 0.0% |
| Lithuanian | 797 | 0.1% |
| Luxembourger | 16 | 0.0% |
| Macedonian | 7 | 0.0% |
| Malaysian | 8 | 0.0% |
| Maltese | 11 | 0.0% |
| Mexican | 45,794 | 7.9% |
| Mexican American Indian | 631 | 0.1% |
| Mongolian | 83 | 0.0% |
| Moroccan | 40 | 0.0% |
| Native Hawaiian | 729 | 0.1% |
| Navajo | 868 | 0.2% |
| New Zealander | 29 | 0.0% |
| Nicaraguan | 72 | 0.0% |
| Nigerian | 234 | 0.0% |
| Northern European | 1,618 | 0.3% |
| Norwegian | 20,816 | 3.6% |
| Osage | 148 | 0.0% |
| Ottawa | 33 | 0.0% |
| Paiute | 11 | 0.0% |
| Pakistani | 322 | 0.1% |
| Palestinian | 1 | 0.0% |
| Panamanian | 198 | 0.0% |
| Pennsylvania German | 283 | 0.1% |
| Peruvian | 374 | 0.1% |
| Pima | 36 | 0.0% |
| Polish | 9,554 | 1.7% |
| Portuguese | 1,398 | 0.2% |
| Potawatomi | 45 | 0.0% |
| Pueblo | 120 | 0.0% |
| Puerto Rican | 1,549 | 0.3% |
| Romanian | 388 | 0.1% |
| Russian | 3,709 | 0.6% |
| Salvadoran | 138 | 0.0% |
| Samoan | 209 | 0.0% |
| Scandinavian | 6,466 | 1.1% |
| Scotch-Irish | 7,565 | 1.3% |
| Scottish | 18,492 | 3.2% |
| Seminole | 25 | 0.0% |
| Senegalese | 56 | 0.0% |
| Serbian | 244 | 0.0% |
| Shoshone | 3,542 | 0.6% |
| Sioux | 1,889 | 0.3% |
| Slavic | 663 | 0.1% |
| Slovak | 394 | 0.1% |
| Slovene | 404 | 0.1% |
| Somali | 26 | 0.0% |
| South African | 39 | 0.0% |
| South American | 1,730 | 0.3% |
| South American Indian | 6 | 0.0% |
| Spaniard | 2,304 | 0.4% |
| Spanish | 3,397 | 0.6% |
| Spanish American | 295 | 0.1% |
| Sri Lankan | 403 | 0.1% |
| Subsaharan African | 1,191 | 0.2% |
| Sudanese | 3 | 0.0% |
| Swedish | 15,054 | 2.6% |
| Swiss | 2,466 | 0.4% |
| Syrian | 19 | 0.0% |
| Thai | 950 | 0.2% |
| Tlingit-Haida | 63 | 0.0% |
| Tohono O'Odham | 12 | 0.0% |
| Tongan | 54 | 0.0% |
| Trinidadian and Tobagonian | 11 | 0.0% |
| Turkish | 116 | 0.0% |
| Ugandan | 36 | 0.0% |
| Ukrainian | 1,161 | 0.2% |
| Ute | 96 | 0.0% |
| Venezuelan | 403 | 0.1% |
| Vietnamese | 40 | 0.0% |
| Welsh | 6,311 | 1.1% |
| West Indian | 12 | 0.0% |
| Yakama | 13 | 0.0% |
| Yaqui | 18 | 0.0% |
| Yugoslavian | 873 | 0.2% |
| Yuman | 15 | 0.0% |
| Yup'ik | 11 | 0.0% | View All 169 Rows |
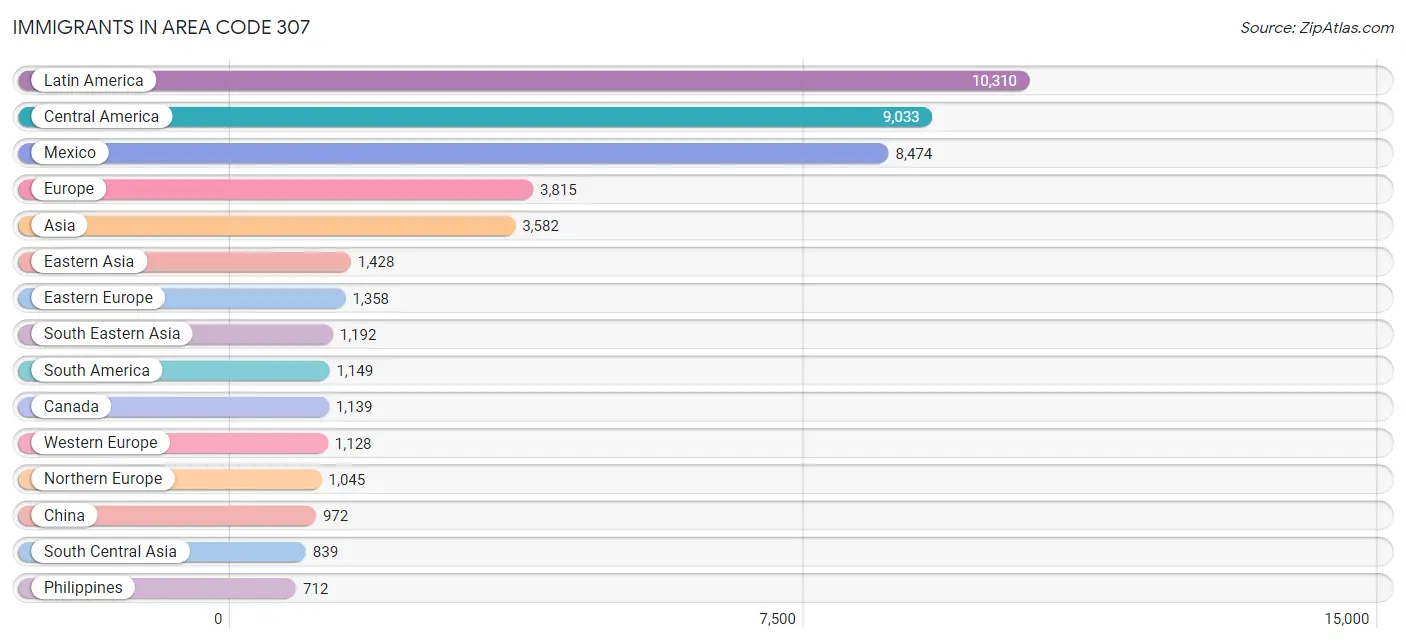
Immigrants in Area Code 307
The most numerous immigrant groups reported in Area Code 307 came from Latin America (10,310 | 1.8%), Central America (9,033 | 1.6%), Mexico (8,474 | 1.5%), Europe (3,815 | 0.7%), and Asia (3,582 | 0.6%), together accounting for 6.1% of all Area Code 307 residents.
| Immigration Origin | # Population | % Population |
| Africa | 684 | 0.1% |
| Albania | 46 | 0.0% |
| Argentina | 66 | 0.0% |
| Asia | 3,582 | 0.6% |
| Australia | 146 | 0.0% |
| Austria | 107 | 0.0% |
| Azores | 7 | 0.0% |
| Bahamas | 21 | 0.0% |
| Bangladesh | 66 | 0.0% |
| Belgium | 30 | 0.0% |
| Bolivia | 3 | 0.0% |
| Bosnia and Herzegovina | 6 | 0.0% |
| Brazil | 26 | 0.0% |
| Bulgaria | 32 | 0.0% |
| Cambodia | 7 | 0.0% |
| Canada | 1,139 | 0.2% |
| Caribbean | 128 | 0.0% |
| Central America | 9,033 | 1.6% |
| Chile | 103 | 0.0% |
| China | 972 | 0.2% |
| Colombia | 284 | 0.1% |
| Costa Rica | 32 | 0.0% |
| Croatia | 35 | 0.0% |
| Cuba | 71 | 0.0% |
| Czechoslovakia | 24 | 0.0% |
| Denmark | 43 | 0.0% |
| Dominican Republic | 5 | 0.0% |
| Eastern Africa | 242 | 0.0% |
| Eastern Asia | 1,428 | 0.3% |
| Eastern Europe | 1,358 | 0.2% |
| Ecuador | 33 | 0.0% |
| Egypt | 52 | 0.0% |
| El Salvador | 105 | 0.0% |
| England | 514 | 0.1% |
| Ethiopia | 3 | 0.0% |
| Europe | 3,815 | 0.7% |
| Fiji | 9 | 0.0% |
| France | 132 | 0.0% |
| Germany | 696 | 0.1% |
| Ghana | 44 | 0.0% |
| Greece | 42 | 0.0% |
| Guatemala | 323 | 0.1% |
| Haiti | 10 | 0.0% |
| Honduras | 22 | 0.0% |
| Hong Kong | 44 | 0.0% |
| Hungary | 16 | 0.0% |
| India | 431 | 0.1% |
| Indonesia | 52 | 0.0% |
| Iran | 131 | 0.0% |
| Ireland | 79 | 0.0% |
| Italy | 108 | 0.0% |
| Jamaica | 19 | 0.0% |
| Japan | 166 | 0.0% |
| Jordan | 15 | 0.0% |
| Kenya | 61 | 0.0% |
| Korea | 290 | 0.1% |
| Latin America | 10,310 | 1.8% |
| Malaysia | 16 | 0.0% |
| Mexico | 8,474 | 1.5% |
| Moldova | 2 | 0.0% |
| Morocco | 21 | 0.0% |
| Nepal | 96 | 0.0% |
| Netherlands | 63 | 0.0% |
| Nicaragua | 26 | 0.0% |
| Nigeria | 132 | 0.0% |
| Northern Africa | 112 | 0.0% |
| Northern Europe | 1,045 | 0.2% |
| Norway | 12 | 0.0% |
| Oceania | 232 | 0.0% |
| Pakistan | 25 | 0.0% |
| Panama | 51 | 0.0% |
| Peru | 331 | 0.1% |
| Philippines | 712 | 0.1% |
| Poland | 141 | 0.0% |
| Portugal | 15 | 0.0% |
| Romania | 176 | 0.0% |
| Russia | 378 | 0.1% |
| Saudi Arabia | 25 | 0.0% |
| Scotland | 41 | 0.0% |
| Senegal | 26 | 0.0% |
| Serbia | 20 | 0.0% |
| Somalia | 26 | 0.0% |
| South Africa | 85 | 0.0% |
| South America | 1,149 | 0.2% |
| South Central Asia | 839 | 0.2% |
| South Eastern Asia | 1,192 | 0.2% |
| Southern Europe | 284 | 0.1% |
| Spain | 119 | 0.0% |
| Sri Lanka | 89 | 0.0% |
| Sudan | 7 | 0.0% |
| Sweden | 63 | 0.0% |
| Switzerland | 100 | 0.0% |
| Taiwan | 84 | 0.0% |
| Thailand | 156 | 0.0% |
| Trinidad and Tobago | 2 | 0.0% |
| Turkey | 72 | 0.0% |
| Uganda | 114 | 0.0% |
| Ukraine | 390 | 0.1% |
| Venezuela | 303 | 0.1% |
| Vietnam | 202 | 0.0% |
| Western Africa | 212 | 0.0% |
| Western Asia | 123 | 0.0% |
| Western Europe | 1,128 | 0.2% | View All 103 Rows |
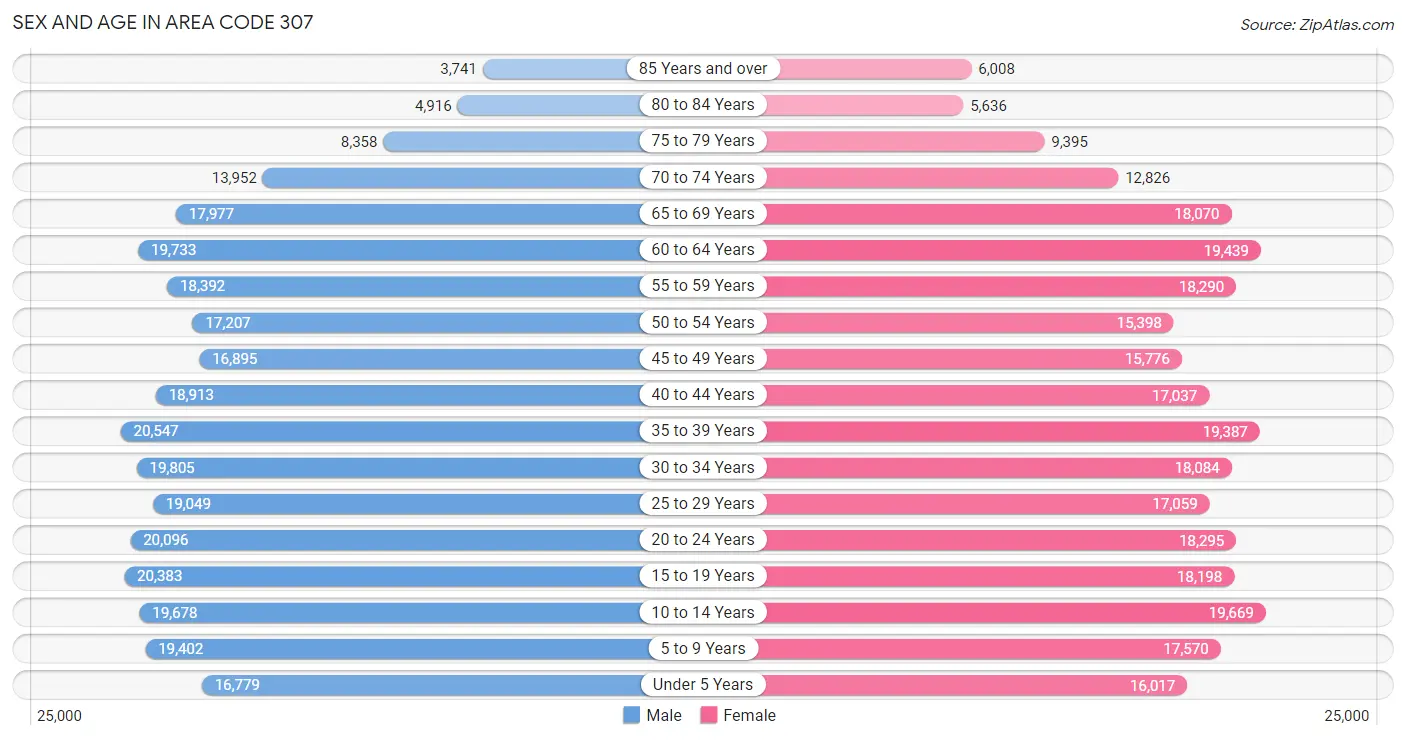
Sex and Age in Area Code 307
Sex and Age in Area Code 307
The most populous age groups in Area Code 307 are 35 to 39 Years (20,547 | 7.0%) for men and 10 to 14 Years (19,669 | 7.0%) for women.
| Age Bracket | Male | Female |
| Under 5 Years | 16,779 (5.7%) | 16,017 (5.7%) |
| 5 to 9 Years | 19,402 (6.6%) | 17,570 (6.2%) |
| 10 to 14 Years | 19,678 (6.7%) | 19,669 (7.0%) |
| 15 to 19 Years | 20,383 (6.9%) | 18,198 (6.5%) |
| 20 to 24 Years | 20,096 (6.8%) | 18,295 (6.5%) |
| 25 to 29 Years | 19,049 (6.4%) | 17,059 (6.0%) |
| 30 to 34 Years | 19,805 (6.7%) | 18,084 (6.4%) |
| 35 to 39 Years | 20,547 (7.0%) | 19,387 (6.9%) |
| 40 to 44 Years | 18,913 (6.4%) | 17,037 (6.0%) |
| 45 to 49 Years | 16,895 (5.7%) | 15,776 (5.6%) |
| 50 to 54 Years | 17,207 (5.8%) | 15,398 (5.5%) |
| 55 to 59 Years | 18,392 (6.2%) | 18,290 (6.5%) |
| 60 to 64 Years | 19,733 (6.7%) | 19,439 (6.9%) |
| 65 to 69 Years | 17,977 (6.1%) | 18,070 (6.4%) |
| 70 to 74 Years | 13,952 (4.7%) | 12,826 (4.5%) |
| 75 to 79 Years | 8,358 (2.8%) | 9,395 (3.3%) |
| 80 to 84 Years | 4,916 (1.7%) | 5,636 (2.0%) |
| 85 Years and over | 3,741 (1.3%) | 6,008 (2.1%) |
| Total | 295,823 (100.0%) | 282,154 (100.0%) |
Families and Households in Area Code 307
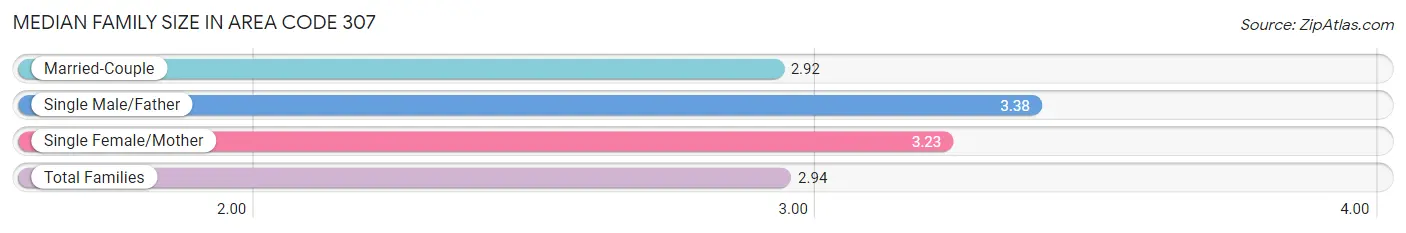
Median Family Size in Area Code 307
The median family size in Area Code 307 is 2.94 persons per family, with single male/father families (10,448 | 7.1%) accounting for the largest median family size of 3.38386 persons per family. On the other hand, married-couple families (118,835 | 80.5%) represent the smallest median family size with 2.92 persons per family.
| Family Type | # Families | Family Size |
| Married-Couple | 118,835 (80.5%) | 2.92 |
| Single Male/Father | 10,448 (7.1%) | 3.38 |
| Single Female/Mother | 18,247 (12.4%) | 3.23 |
| Total Families | 147,530 (100.0%) | 2.94 |
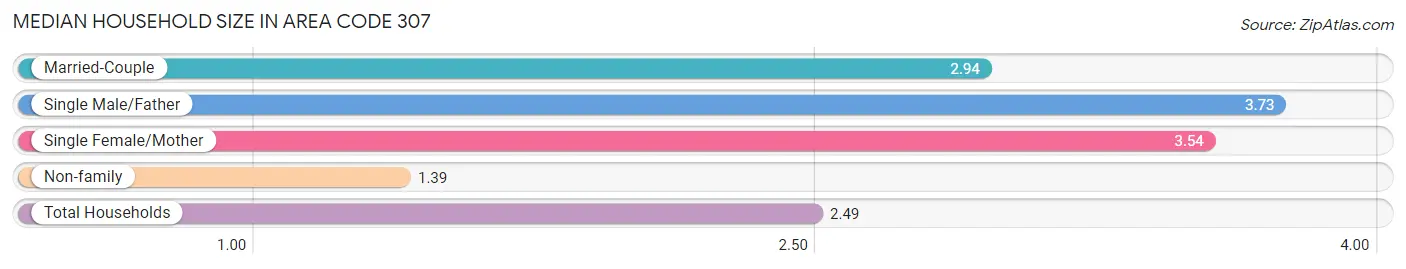
Median Household Size in Area Code 307
The median household size in Area Code 307 is 2.49 persons per household, with single male/father households (10,448 | 4.5%) accounting for the largest median household size of 3.73056 persons per household. non-family households (86,625 | 37.0%) represent the smallest median household size with 1.39 persons per household.
| Household Type | # Households | Household Size |
| Married-Couple | 118,835 (50.7%) | 2.94 |
| Single Male/Father | 10,448 (4.5%) | 3.73 |
| Single Female/Mother | 18,247 (7.8%) | 3.54 |
| Non-family | 86,625 (37.0%) | 1.39 |
| Total Households | 234,155 (100.0%) | 2.49 |
Household Size by Marriage Status in Area Code 307
Out of a total of 234,155 households in Area Code 307, 147,530 (63.0%) are family households, while 86,625 (37.0%) are nonfamily households. The most numerous type of family households are 2-person households, comprising 72,934, and the most common type of nonfamily households are 1-person households, comprising 70,945.
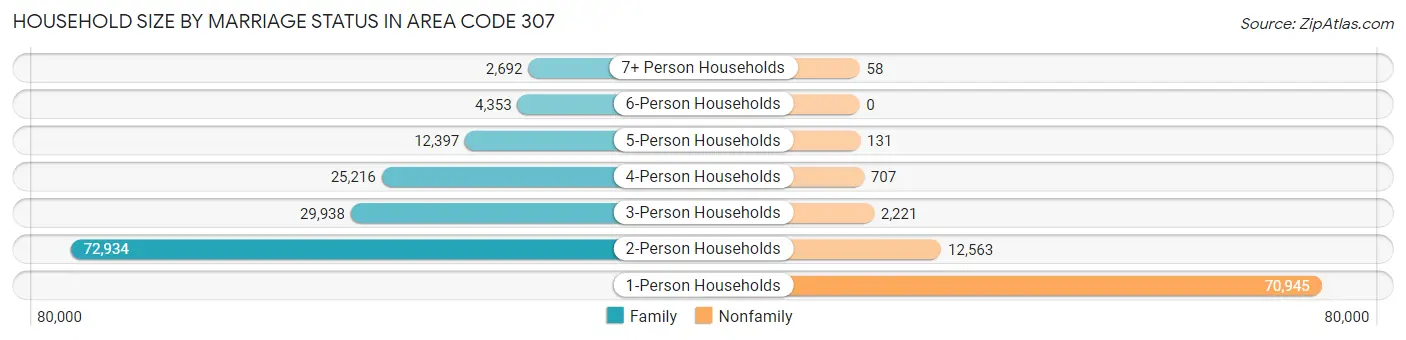
| Household Size | Family Households | Nonfamily Households |
| 1-Person Households | - | 70,945 (30.3%) |
| 2-Person Households | 72,934 (31.1%) | 12,563 (5.4%) |
| 3-Person Households | 29,938 (12.8%) | 2,221 (0.9%) |
| 4-Person Households | 25,216 (10.8%) | 707 (0.3%) |
| 5-Person Households | 12,397 (5.3%) | 131 (0.1%) |
| 6-Person Households | 4,353 (1.9%) | 0 (0.0%) |
| 7+ Person Households | 2,692 (1.1%) | 58 (0.0%) |
| Total | 147,530 (63.0%) | 86,625 (37.0%) |
Female Fertility in Area Code 307
Fertility by Age in Area Code 307
Average fertility rate in Area Code 307 is 133.1 births per 1,000 women. Women in the age bracket of 20 to 34 years have the highest fertility rate with 250.4 births per 1,000 women. Women in the age bracket of 20 to 34 years acount for 75.4% of all women with births.
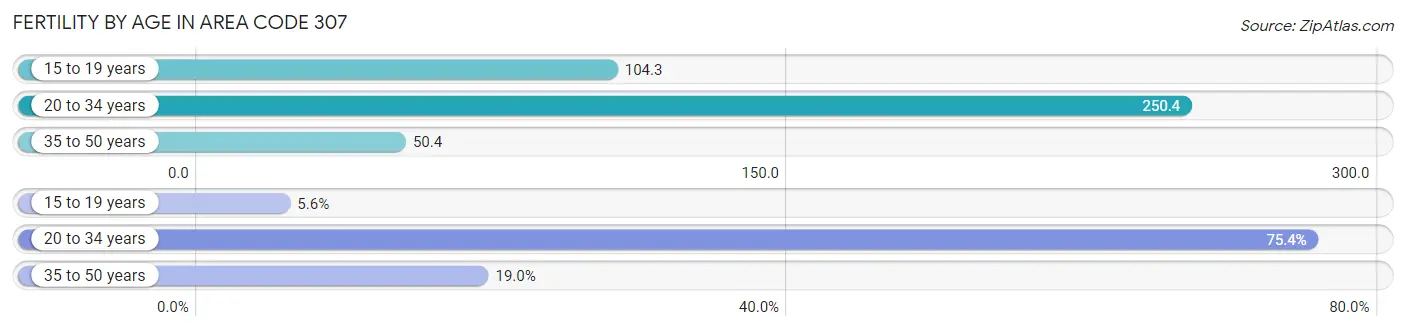
| Age Bracket | Women with Births | Births / 1,000 Women |
| 15 to 19 years | 445 (5.6%) | 104.3 |
| 20 to 34 years | 5,995 (75.4%) | 250.4 |
| 35 to 50 years | 1,515 (19.0%) | 50.4 |
| Total | 7,955 (100.0%) | 133.1 |
Fertility by Age by Marriage Status in Area Code 307
48.9% of women with births (7,955) in Area Code 307 are married. The highest percentage of unmarried women with births falls into 15 to 19 years age bracket with 97.8% of them unmarried at the time of birth, while the lowest percentage of unmarried women with births belong to 20 to 34 years age bracket with 52.9% of them unmarried.
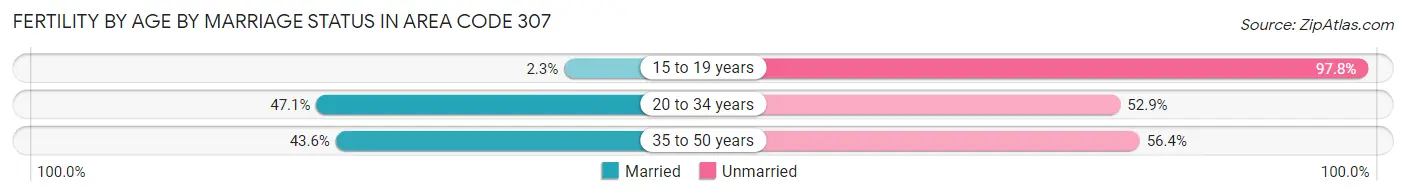
| Age Bracket | Married | Unmarried |
| 15 to 19 years | 10 (2.2%) | 435 (97.8%) |
| 20 to 34 years | 2,826 (47.1%) | 3,169 (52.9%) |
| 35 to 50 years | 661 (43.6%) | 854 (56.4%) |
| Total | 3,893 (48.9%) | 4,062 (51.1%) |
Fertility by Education in Area Code 307
Average fertility rate in Area Code 307 is 133.1 births per 1,000 women. Women with the education attainment of bachelor's degree have the highest fertility rate of 210.2 births per 1,000 women, while women with the education attainment of college or associate's degree have the lowest fertility at 132.0 births per 1,000 women. Women with the education attainment of college or associate's degree represent 31.1% of all women with births.
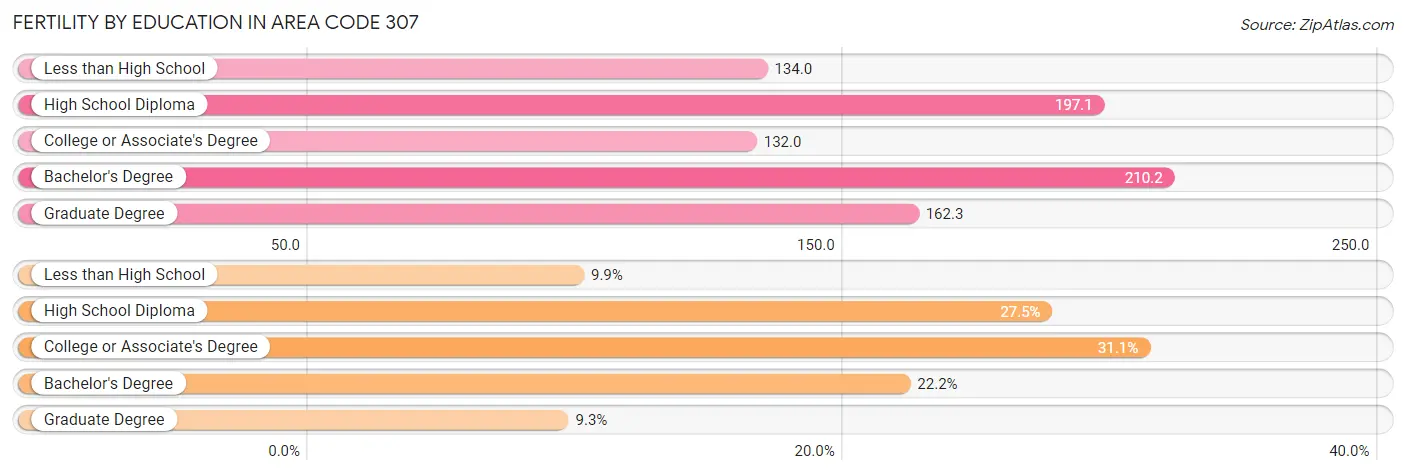
| Educational Attainment | Women with Births | Births / 1,000 Women |
| Less than High School | 789 (9.9%) | 134.0 |
| High School Diploma | 2,185 (27.5%) | 197.1 |
| College or Associate's Degree | 2,476 (31.1%) | 132.0 |
| Bachelor's Degree | 1,762 (22.2%) | 210.2 |
| Graduate Degree | 743 (9.3%) | 162.3 |
| Total | 7,955 (100.0%) | 133.1 |
Fertility by Education by Marriage Status in Area Code 307
51.1% of women with births in Area Code 307 are unmarried. Women with the educational attainment of bachelor's degree are most likely to be married with 56.8% of them married at childbirth, while women with the educational attainment of less than high school are least likely to be married with 85.2% of them unmarried at childbirth.
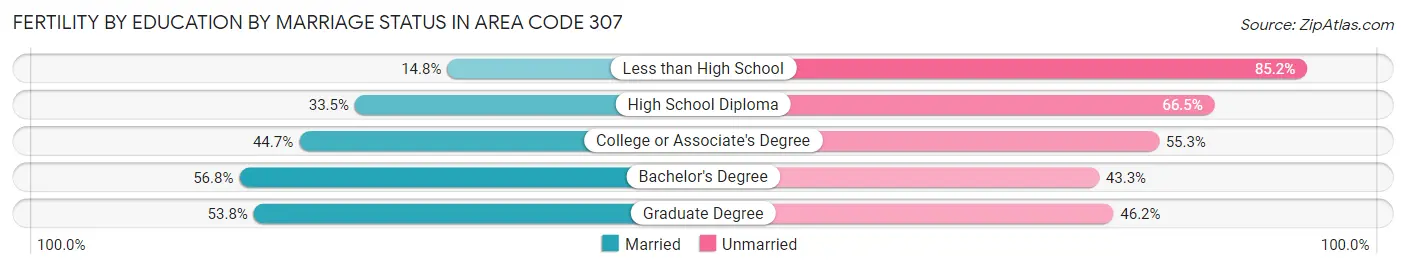
| Educational Attainment | Married | Unmarried |
| Less than High School | 117 (14.8%) | 672 (85.2%) |
| High School Diploma | 731 (33.5%) | 1,454 (66.5%) |
| College or Associate's Degree | 1,107 (44.7%) | 1,369 (55.3%) |
| Bachelor's Degree | 1,000 (56.8%) | 762 (43.2%) |
| Graduate Degree | 400 (53.8%) | 343 (46.2%) |
| Total | 3,893 (48.9%) | 4,062 (51.1%) |
Employment Characteristics in Area Code 307
Employment by Class of Employer in Area Code 307
Among the 284,688 employed individuals in Area Code 307, private company employees (168,325 | 59.1%), local government employees (29,775 | 10.5%), and not-for-profit organizations (19,601 | 6.9%) make up the most common classes of employment.
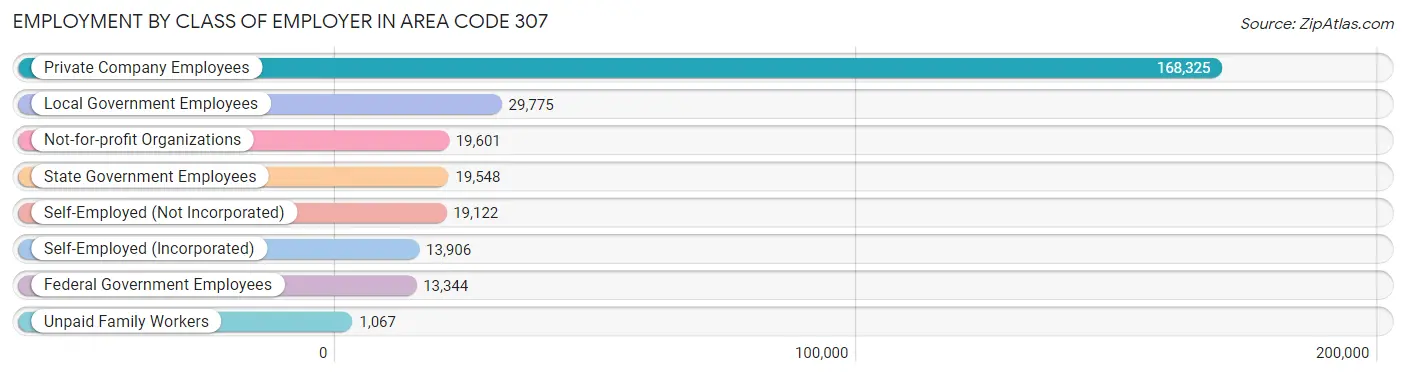
| Employer Class | # Employees | % Employees |
| Private Company Employees | 168,325 | 59.1% |
| Self-Employed (Incorporated) | 13,906 | 4.9% |
| Self-Employed (Not Incorporated) | 19,122 | 6.7% |
| Not-for-profit Organizations | 19,601 | 6.9% |
| Local Government Employees | 29,775 | 10.5% |
| State Government Employees | 19,548 | 6.9% |
| Federal Government Employees | 13,344 | 4.7% |
| Unpaid Family Workers | 1,067 | 0.4% |
| Total | 284,688 | 100.0% |
Employment Status by Age in Area Code 307
According to the labor force statistics for Area Code 307, out of the total population over 16 years of age (460,725), 64.0% or 295,002 individuals are in the labor force, with 7.2% or 21,299 of them unemployed. The age group with the highest labor force participation rate is 30 to 34 years, with 87.3% or 33,085 individuals in the labor force. Within the labor force, the 16 to 19 years age range has the highest percentage of unemployed individuals, with 1,146.1% or 192,705 of them being unemployed.
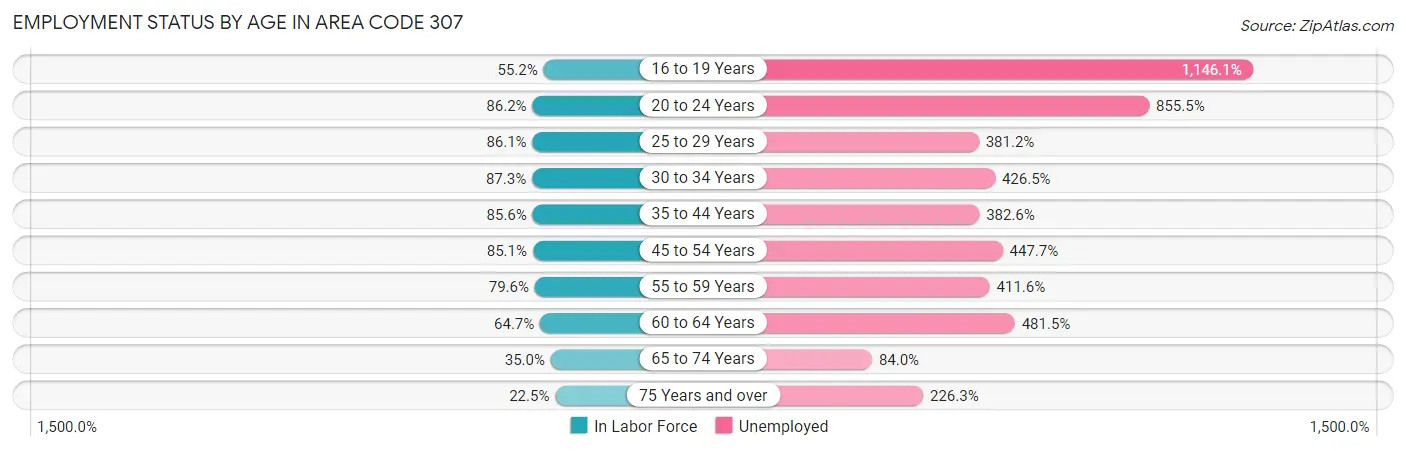
| Age Bracket | In Labor Force | Unemployed |
| 16 to 19 Years | 16,815 (55.2%) | 192,705 (1,146.1%) |
| 20 to 24 Years | 33,080 (86.2%) | 283,017 (855.5%) |
| 25 to 29 Years | 31,074 (86.1%) | 118,458 (381.2%) |
| 30 to 34 Years | 33,084 (87.3%) | 141,108 (426.5%) |
| 35 to 44 Years | 64,941 (85.6%) | 248,468 (382.6%) |
| 45 to 54 Years | 55,570 (85.1%) | 248,782 (447.7%) |
| 55 to 59 Years | 29,195 (79.6%) | 120,167 (411.6%) |
| 60 to 64 Years | 25,343 (64.7%) | 122,031 (481.5%) |
| 65 to 74 Years | 21,989 (35.0%) | 18,471 (84.0%) |
| 75 Years and over | 8,569 (22.5%) | 19,394 (226.3%) |
| Total | 294,992 (64.0%) | 21,289 (7.2%) |
Employment Status by Educational Attainment in Area Code 307
According to labor force statistics for Area Code 307, 79.1% of individuals (230,248) out of the total population between 25 and 64 years of age (291,011) are in the labor force, with 583.5% or 1,343,497 of them being unemployed. The group with the highest labor force participation rate are those with the educational attainment of bachelor's degree or higher, with 84.5% or 71,984 individuals in the labor force. Within the labor force, individuals with less than high school education have the highest percentage of unemployment, with 766.4% or 91,692 of them being unemployed.
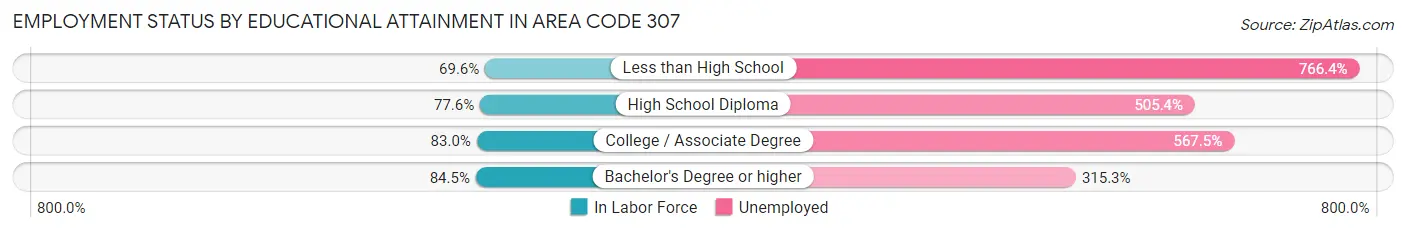
| Educational Attainment | In Labor Force | Unemployed |
| Less than High School | 11,965 (69.6%) | 131,782 (766.4%) |
| High School Diploma | 61,124 (77.6%) | 398,048 (505.4%) |
| College / Associate Degree | 91,164 (83.0%) | 623,331 (567.5%) |
| Bachelor's Degree or higher | 71,988 (84.5%) | 268,696 (315.3%) |
| Total | 230,246 (79.1%) | 1,698,049 (583.5%) |
Employment Occupations by Sex in Area Code 307
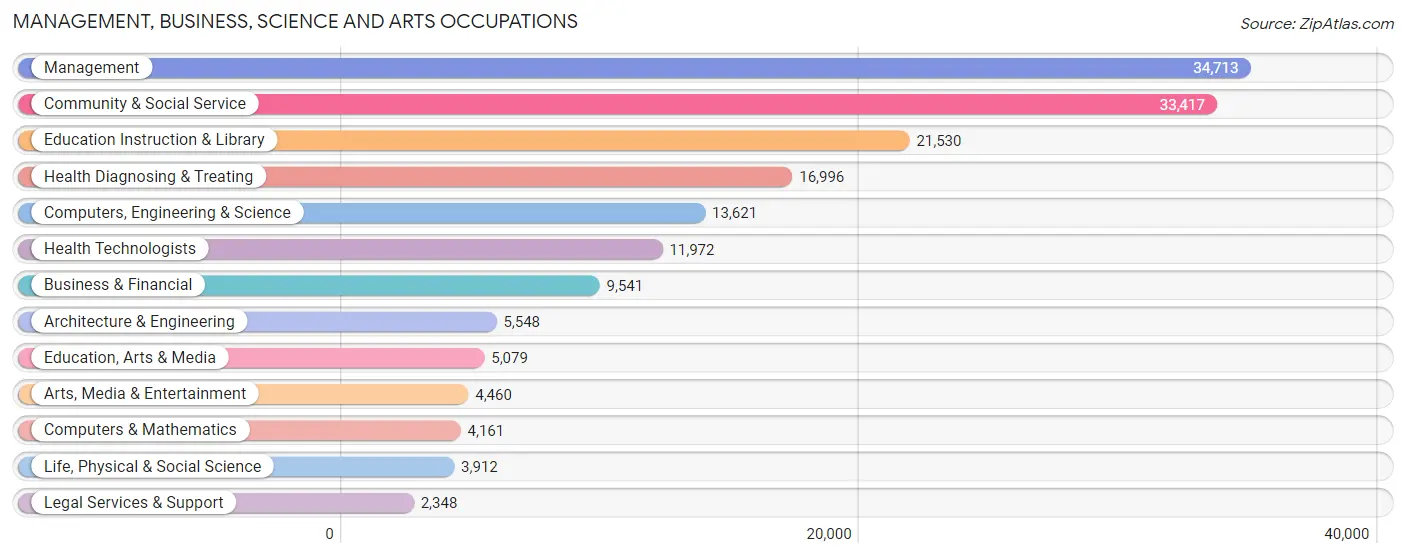
Management, Business, Science and Arts Occupations
The most common Management, Business, Science and Arts occupations in Area Code 307 are Management (34,713 | 12.0%), Community & Social Service (33,417 | 11.6%), Education Instruction & Library (21,530 | 7.5%), Health Diagnosing & Treating (16,996 | 5.9%), and Computers, Engineering & Science (13,621 | 4.7%).
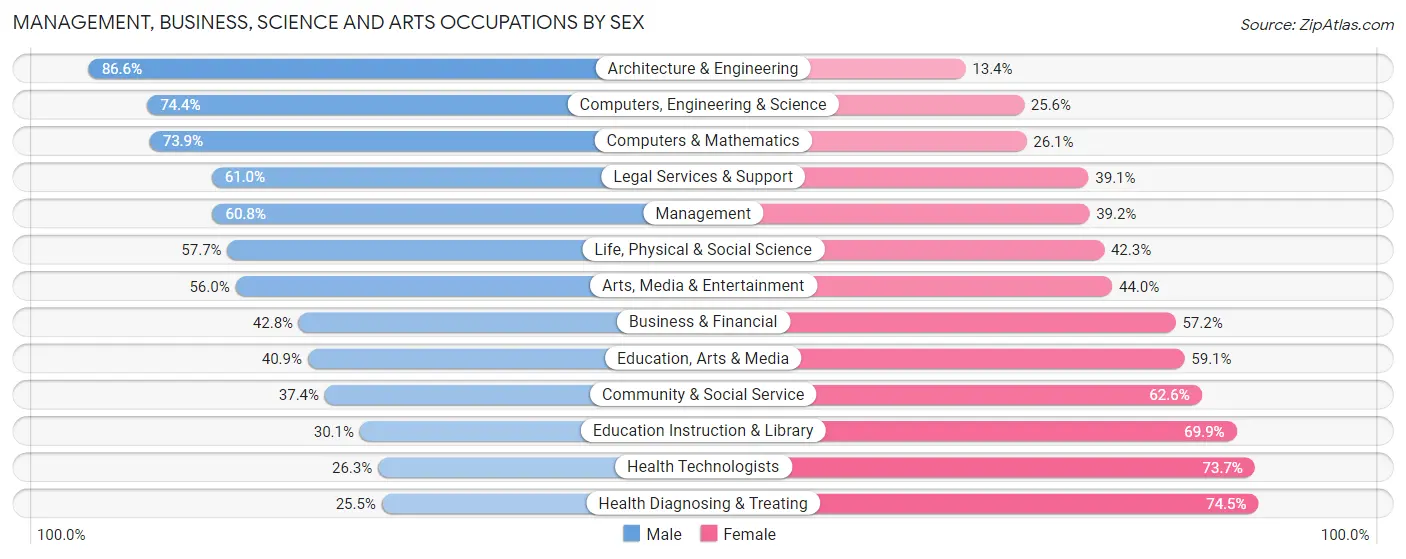
Management, Business, Science and Arts Occupations by Sex
Within the Management, Business, Science and Arts occupations in Area Code 307, the most male-oriented occupations are Architecture & Engineering (86.6%), Computers, Engineering & Science (74.4%), and Computers & Mathematics (73.9%), while the most female-oriented occupations are Health Diagnosing & Treating (74.5%), Health Technologists (73.7%), and Education Instruction & Library (69.9%).
| Occupation | Male | Female |
| Management | 21,098 (60.8%) | 13,615 (39.2%) |
| Business & Financial | 4,082 (42.8%) | 5,459 (57.2%) |
| Computers, Engineering & Science | 10,136 (74.4%) | 3,485 (25.6%) |
| Computers & Mathematics | 3,074 (73.9%) | 1,087 (26.1%) |
| Architecture & Engineering | 4,805 (86.6%) | 743 (13.4%) |
| Life, Physical & Social Science | 2,257 (57.7%) | 1,655 (42.3%) |
| Community & Social Service | 12,485 (37.4%) | 20,932 (62.6%) |
| Education, Arts & Media | 2,079 (40.9%) | 3,000 (59.1%) |
| Legal Services & Support | 1,431 (61.0%) | 917 (39.1%) |
| Education Instruction & Library | 6,477 (30.1%) | 15,053 (69.9%) |
| Arts, Media & Entertainment | 2,498 (56.0%) | 1,962 (44.0%) |
| Health Diagnosing & Treating | 4,335 (25.5%) | 12,661 (74.5%) |
| Health Technologists | 3,145 (26.3%) | 8,827 (73.7%) |
| Total (Category) | 52,136 (48.1%) | 56,152 (51.8%) |
| Total (Overall) | 157,080 (54.5%) | 130,948 (45.5%) |
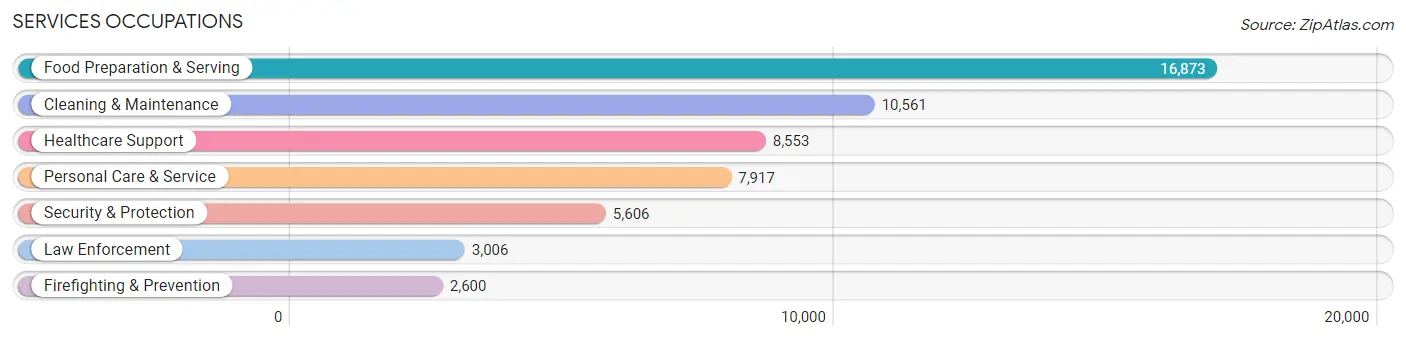
Services Occupations
The most common Services occupations in Area Code 307 are Food Preparation & Serving (16,873 | 5.9%), Cleaning & Maintenance (10,561 | 3.7%), Healthcare Support (8,553 | 3.0%), Personal Care & Service (7,917 | 2.8%), and Security & Protection (5,606 | 1.9%).
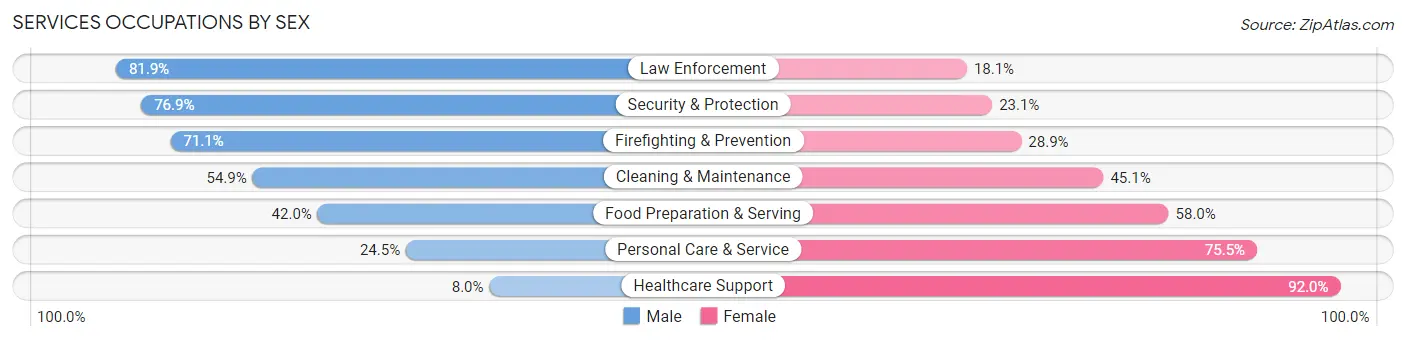
Services Occupations by Sex
Within the Services occupations in Area Code 307, the most male-oriented occupations are Law Enforcement (81.9%), Security & Protection (76.9%), and Firefighting & Prevention (71.1%), while the most female-oriented occupations are Healthcare Support (92.0%), Personal Care & Service (75.5%), and Food Preparation & Serving (58.0%).
| Occupation | Male | Female |
| Healthcare Support | 682 (8.0%) | 7,871 (92.0%) |
| Security & Protection | 4,311 (76.9%) | 1,295 (23.1%) |
| Firefighting & Prevention | 1,849 (71.1%) | 751 (28.9%) |
| Law Enforcement | 2,462 (81.9%) | 544 (18.1%) |
| Food Preparation & Serving | 7,082 (42.0%) | 9,791 (58.0%) |
| Cleaning & Maintenance | 5,794 (54.9%) | 4,767 (45.1%) |
| Personal Care & Service | 1,938 (24.5%) | 5,979 (75.5%) |
| Total (Category) | 19,807 (40.0%) | 29,703 (60.0%) |
| Total (Overall) | 157,080 (54.5%) | 130,948 (45.5%) |
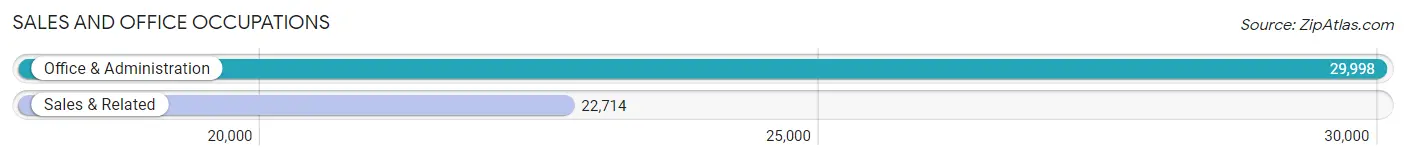
Sales and Office Occupations
The most common Sales and Office occupations in Area Code 307 are Office & Administration (29,998 | 10.4%), and Sales & Related (22,714 | 7.9%).
Sales and Office Occupations by Sex
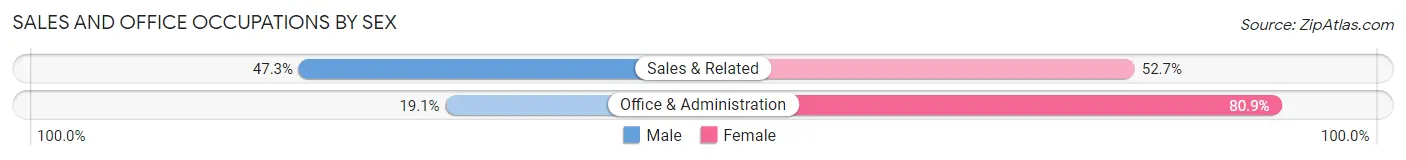
| Occupation | Male | Female |
| Sales & Related | 10,735 (47.3%) | 11,979 (52.7%) |
| Office & Administration | 5,721 (19.1%) | 24,277 (80.9%) |
| Total (Category) | 16,456 (31.2%) | 36,256 (68.8%) |
| Total (Overall) | 157,080 (54.5%) | 130,948 (45.5%) |
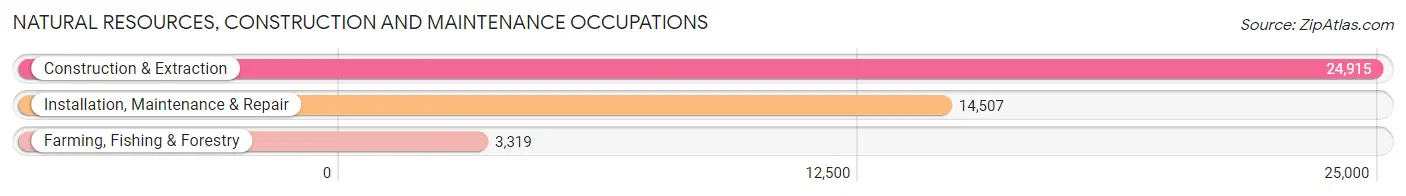
Natural Resources, Construction and Maintenance Occupations
The most common Natural Resources, Construction and Maintenance occupations in Area Code 307 are Construction & Extraction (24,915 | 8.6%), Installation, Maintenance & Repair (14,507 | 5.0%), and Farming, Fishing & Forestry (3,319 | 1.1%).
Natural Resources, Construction and Maintenance Occupations by Sex
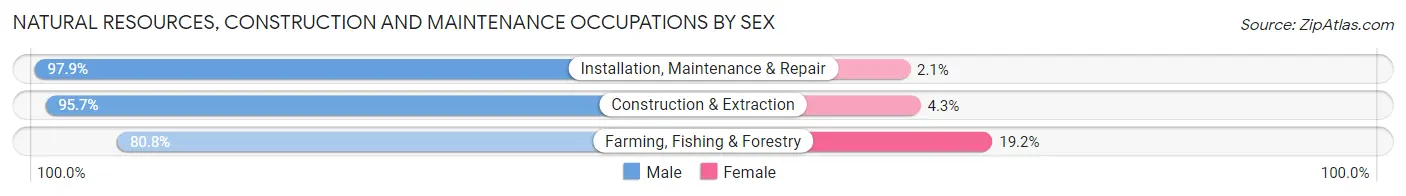
| Occupation | Male | Female |
| Farming, Fishing & Forestry | 2,681 (80.8%) | 638 (19.2%) |
| Construction & Extraction | 23,847 (95.7%) | 1,068 (4.3%) |
| Installation, Maintenance & Repair | 14,203 (97.9%) | 304 (2.1%) |
| Total (Category) | 40,731 (95.3%) | 2,010 (4.7%) |
| Total (Overall) | 157,080 (54.5%) | 130,948 (45.5%) |
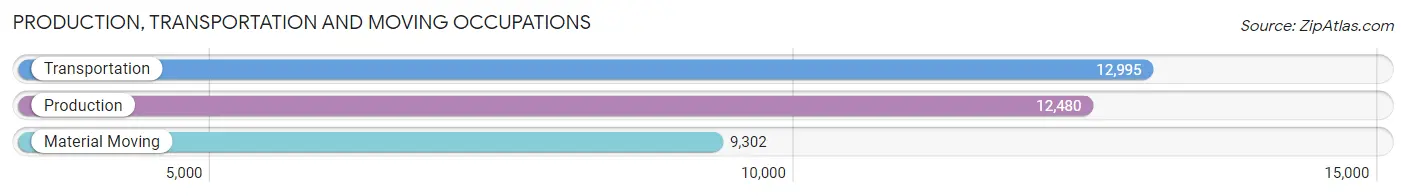
Production, Transportation and Moving Occupations
The most common Production, Transportation and Moving occupations in Area Code 307 are Transportation (12,995 | 4.5%), Production (12,480 | 4.3%), and Material Moving (9,302 | 3.2%).
Production, Transportation and Moving Occupations by Sex
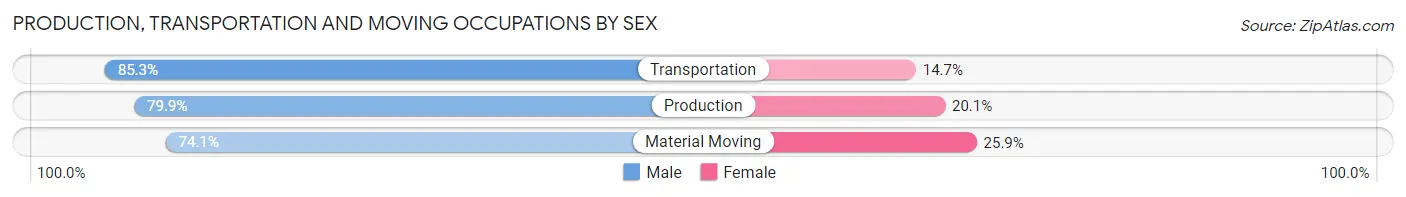
| Occupation | Male | Female |
| Production | 9,973 (79.9%) | 2,507 (20.1%) |
| Transportation | 11,082 (85.3%) | 1,913 (14.7%) |
| Material Moving | 6,895 (74.1%) | 2,407 (25.9%) |
| Total (Category) | 27,950 (80.4%) | 6,827 (19.6%) |
| Total (Overall) | 157,080 (54.5%) | 130,948 (45.5%) |
Employment Industries by Sex in Area Code 307
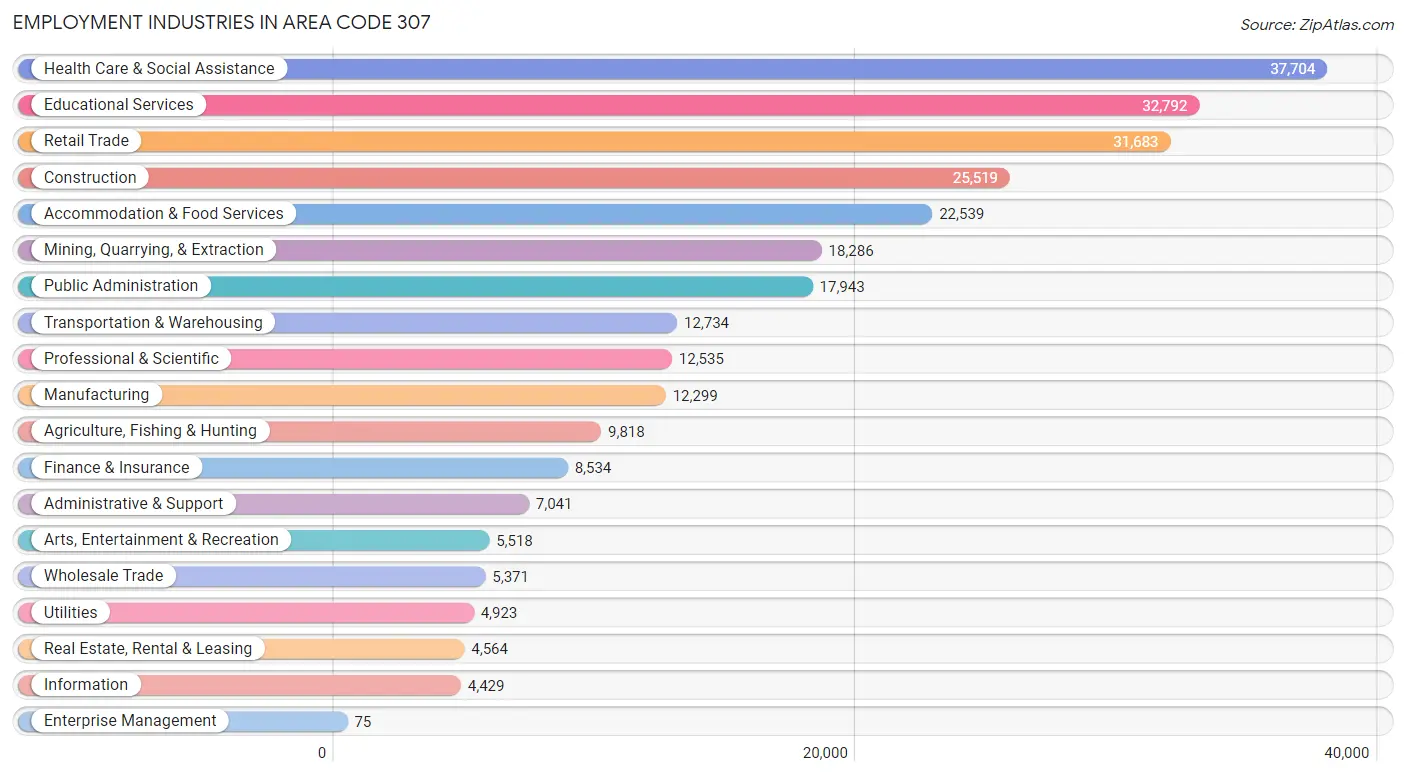
Employment Industries in Area Code 307
The major employment industries in Area Code 307 include Health Care & Social Assistance (37,704 | 13.1%), Educational Services (32,792 | 11.4%), Retail Trade (31,683 | 11.0%), Construction (25,519 | 8.9%), and Accommodation & Food Services (22,539 | 7.8%).
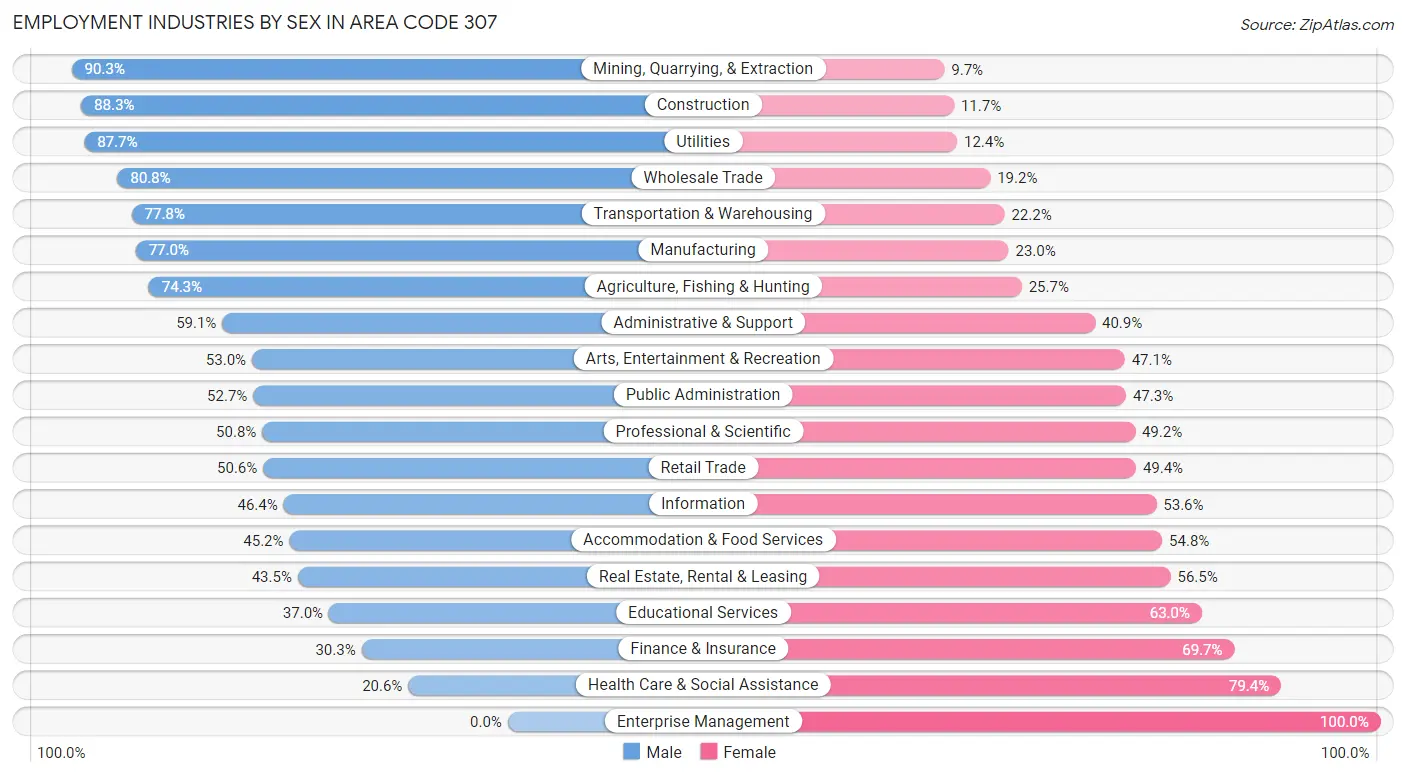
Employment Industries by Sex in Area Code 307
The Area Code 307 industries that see more men than women are Mining, Quarrying, & Extraction (90.3%), Construction (88.3%), and Utilities (87.6%), whereas the industries that tend to have a higher number of women are Enterprise Management (100.0%), Health Care & Social Assistance (79.4%), and Finance & Insurance (69.7%).
| Industry | Male | Female |
| Agriculture, Fishing & Hunting | 7,292 (74.3%) | 2,526 (25.7%) |
| Mining, Quarrying, & Extraction | 16,510 (90.3%) | 1,776 (9.7%) |
| Construction | 22,532 (88.3%) | 2,987 (11.7%) |
| Manufacturing | 9,470 (77.0%) | 2,829 (23.0%) |
| Wholesale Trade | 4,339 (80.8%) | 1,032 (19.2%) |
| Retail Trade | 16,042 (50.6%) | 15,641 (49.4%) |
| Transportation & Warehousing | 9,912 (77.8%) | 2,822 (22.2%) |
| Utilities | 4,315 (87.6%) | 608 (12.3%) |
| Information | 2,055 (46.4%) | 2,374 (53.6%) |
| Finance & Insurance | 2,583 (30.3%) | 5,951 (69.7%) |
| Real Estate, Rental & Leasing | 1,984 (43.5%) | 2,580 (56.5%) |
| Professional & Scientific | 6,371 (50.8%) | 6,164 (49.2%) |
| Enterprise Management | 0 (0.0%) | 75 (100.0%) |
| Administrative & Support | 4,161 (59.1%) | 2,880 (40.9%) |
| Educational Services | 12,135 (37.0%) | 20,657 (63.0%) |
| Health Care & Social Assistance | 7,768 (20.6%) | 29,936 (79.4%) |
| Arts, Entertainment & Recreation | 2,922 (52.9%) | 2,596 (47.0%) |
| Accommodation & Food Services | 10,188 (45.2%) | 12,351 (54.8%) |
| Public Administration | 9,455 (52.7%) | 8,488 (47.3%) |
| Total | 157,080 (54.5%) | 130,948 (45.5%) |
Education in Area Code 307
School Enrollment in Area Code 307
The most common levels of schooling among the 142,763 students in Area Code 307 are high school (30,750 | 21.5%), middle school (30,696 | 21.5%), and college / undergraduate (29,523 | 20.7%).
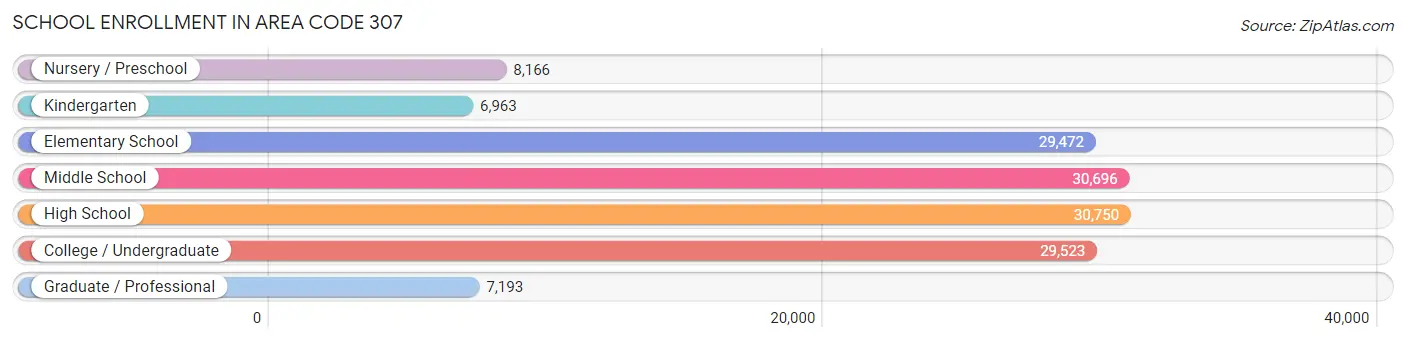
| School Level | # Students | % Students |
| Nursery / Preschool | 8,166 | 5.7% |
| Kindergarten | 6,963 | 4.9% |
| Elementary School | 29,472 | 20.6% |
| Middle School | 30,696 | 21.5% |
| High School | 30,750 | 21.5% |
| College / Undergraduate | 29,523 | 20.7% |
| Graduate / Professional | 7,193 | 5.0% |
| Total | 142,763 | 100.0% |
School Enrollment by Age by Funding Source in Area Code 307
Out of a total of 142,763 students who are enrolled in schools in Area Code 307, 14,436 (10.1%) attend a private institution, while the remaining 128,327 (89.9%) are enrolled in public schools. The age group of 3 to 4 year olds has the highest likelihood of being enrolled in private schools, with 1,986 (34.7% in the age bracket) enrolled. Conversely, the age group of 15 to 17 year olds has the lowest likelihood of being enrolled in a private school, with 20,768 (93.3% in the age bracket) attending a public institution.
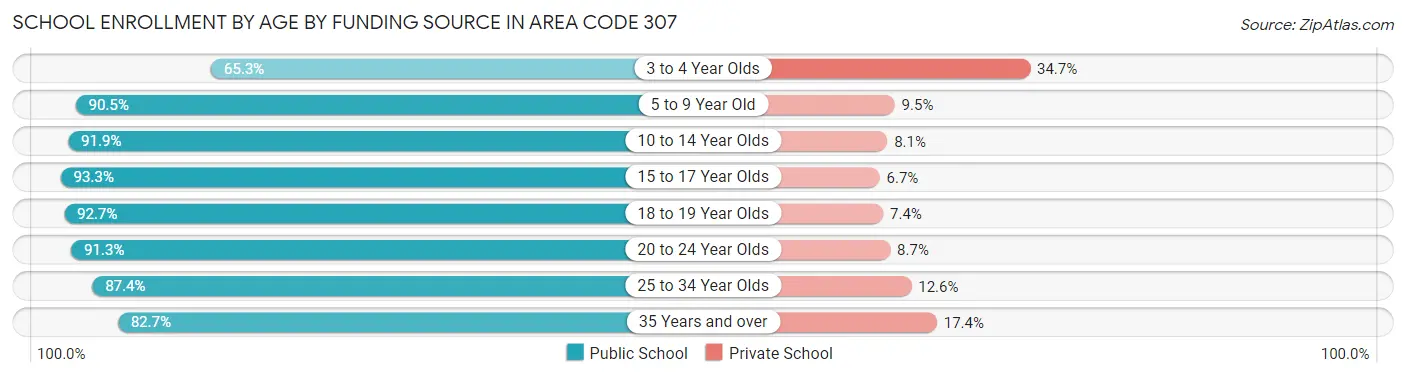
| Age Bracket | Public School | Private School |
| 3 to 4 Year Olds | 3,736 (65.3%) | 1,986 (34.7%) |
| 5 to 9 Year Old | 31,403 (90.5%) | 3,296 (9.5%) |
| 10 to 14 Year Olds | 35,283 (91.9%) | 3,113 (8.1%) |
| 15 to 17 Year Olds | 20,768 (93.3%) | 1,490 (6.7%) |
| 18 to 19 Year Olds | 10,195 (92.6%) | 809 (7.3%) |
| 20 to 24 Year Olds | 12,715 (91.3%) | 1,205 (8.7%) |
| 25 to 34 Year Olds | 6,971 (87.4%) | 1,005 (12.6%) |
| 35 Years and over | 7,263 (82.7%) | 1,525 (17.3%) |
| Total | 128,327 (89.9%) | 14,436 (10.1%) |
Educational Attainment by Field of Study in Area Code 307
Education (22,785 | 18.5%), business (16,655 | 13.5%), bio, nature & agricultural (14,124 | 11.4%), science & technology (13,223 | 10.7%), and arts & humanities (8,526 | 6.9%) are the most common fields of study among 123,447 individuals in Area Code 307 who have obtained a bachelor's degree or higher.
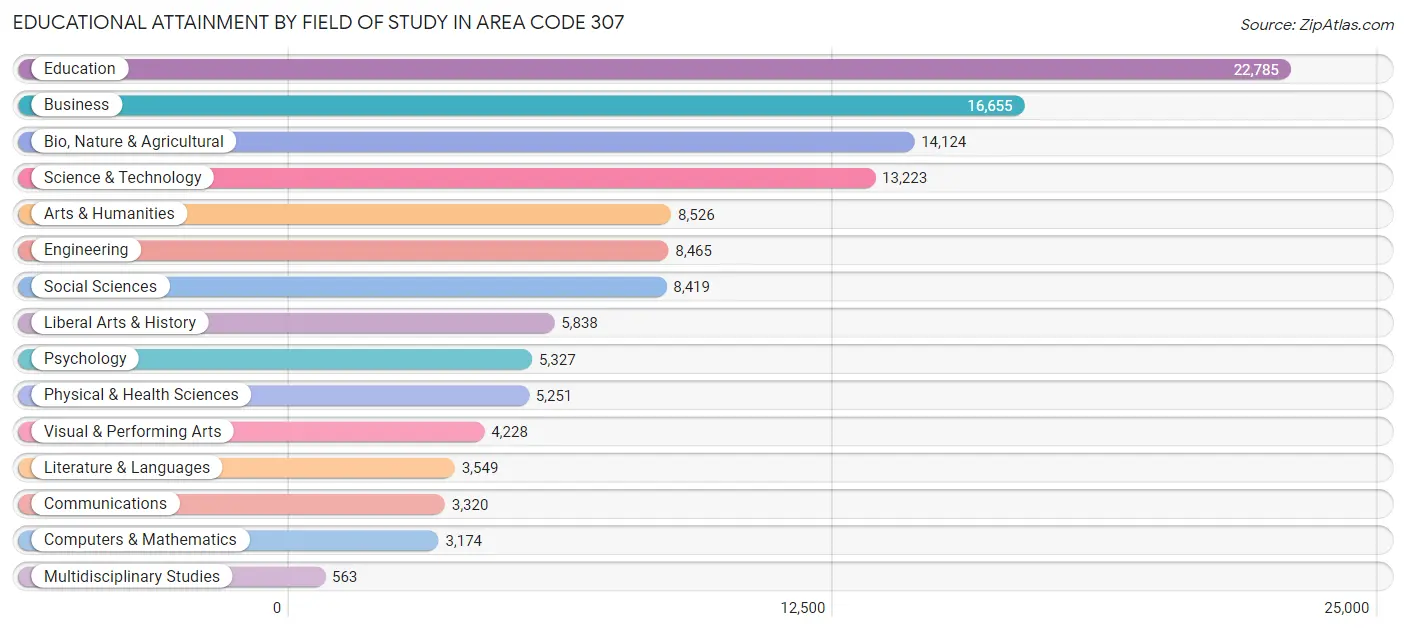
| Field of Study | # Graduates | % Graduates |
| Computers & Mathematics | 3,174 | 2.6% |
| Bio, Nature & Agricultural | 14,124 | 11.4% |
| Physical & Health Sciences | 5,251 | 4.3% |
| Psychology | 5,327 | 4.3% |
| Social Sciences | 8,419 | 6.8% |
| Engineering | 8,465 | 6.9% |
| Multidisciplinary Studies | 563 | 0.5% |
| Science & Technology | 13,223 | 10.7% |
| Business | 16,655 | 13.5% |
| Education | 22,785 | 18.5% |
| Literature & Languages | 3,549 | 2.9% |
| Liberal Arts & History | 5,838 | 4.7% |
| Visual & Performing Arts | 4,228 | 3.4% |
| Communications | 3,320 | 2.7% |
| Arts & Humanities | 8,526 | 6.9% |
| Total | 123,447 | 100.0% |
Transportation & Commute in Area Code 307
Vehicle Availability by Sex in Area Code 307
The most prevalent vehicle ownership categories in Area Code 307 are males with 2 vehicles (56,829, accounting for 36.8%) and females with 2 vehicles (45,324, making up 44.8%).
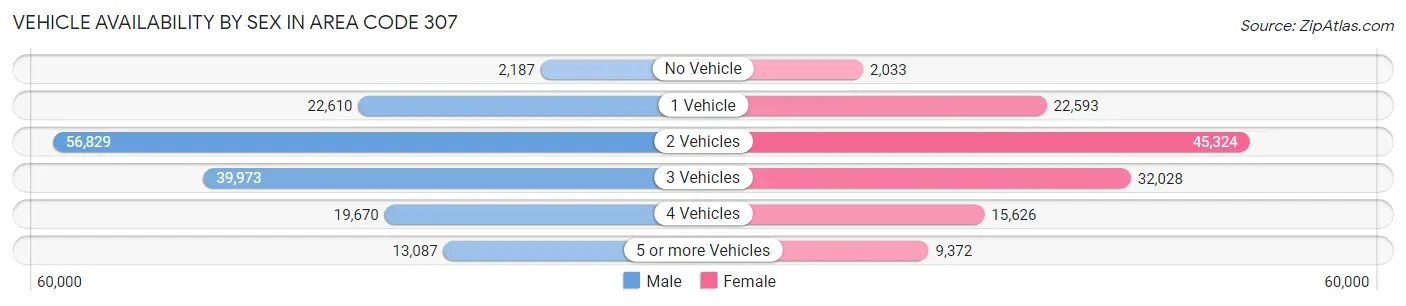
| Vehicles Available | Male | Female |
| No Vehicle | 2,187 (1.4%) | 2,033 (1.6%) |
| 1 Vehicle | 22,610 (14.6%) | 22,593 (17.8%) |
| 2 Vehicles | 56,829 (36.8%) | 45,324 (35.7%) |
| 3 Vehicles | 39,973 (25.9%) | 32,028 (25.2%) |
| 4 Vehicles | 19,670 (12.7%) | 15,626 (12.3%) |
| 5 or more Vehicles | 13,087 (8.5%) | 9,372 (7.4%) |
| Total | 154,356 (100.0%) | 126,976 (100.0%) |
Commute Time in Area Code 307
The most frequently occuring commute durations in Area Code 307 are 5 to 9 minutes (62,542 commuters, 23.8%), 10 to 14 minutes (59,451 commuters, 22.6%), and 15 to 19 minutes (45,083 commuters, 17.2%).
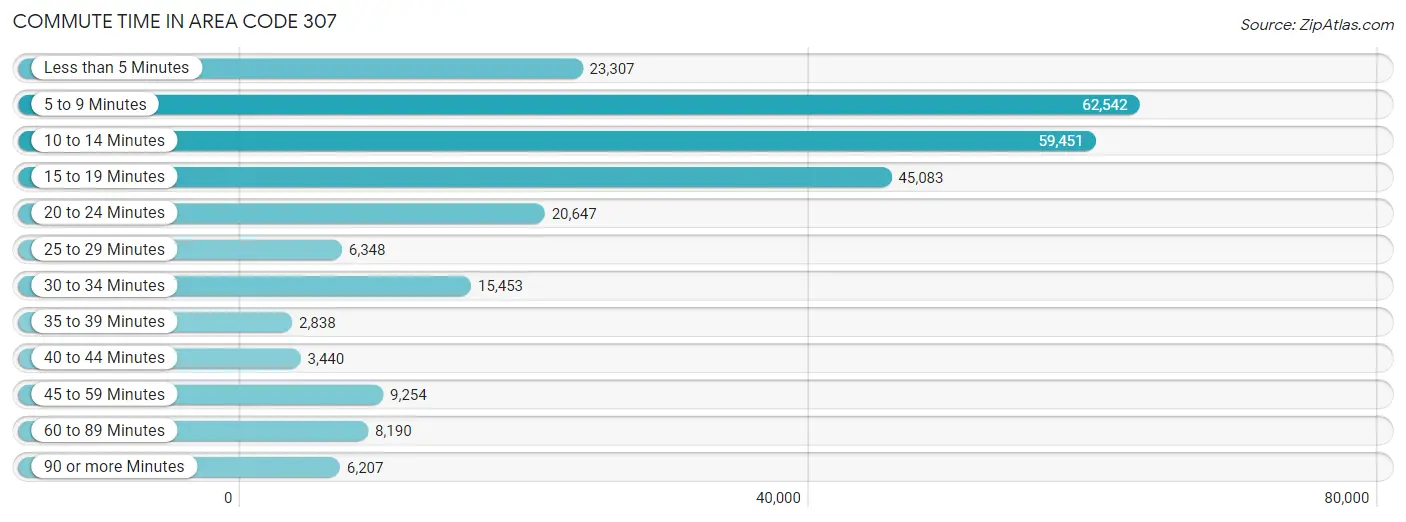
| Commute Time | # Commuters | % Commuters |
| Less than 5 Minutes | 23,307 | 8.9% |
| 5 to 9 Minutes | 62,542 | 23.8% |
| 10 to 14 Minutes | 59,451 | 22.6% |
| 15 to 19 Minutes | 45,083 | 17.2% |
| 20 to 24 Minutes | 20,647 | 7.9% |
| 25 to 29 Minutes | 6,348 | 2.4% |
| 30 to 34 Minutes | 15,453 | 5.9% |
| 35 to 39 Minutes | 2,838 | 1.1% |
| 40 to 44 Minutes | 3,440 | 1.3% |
| 45 to 59 Minutes | 9,254 | 3.5% |
| 60 to 89 Minutes | 8,190 | 3.1% |
| 90 or more Minutes | 6,207 | 2.4% |
Commute Time by Sex in Area Code 307
The most common commute times in Area Code 307 are 5 to 9 minutes (31,043 commuters, 21.3%) for males and 5 to 9 minutes (31,499 commuters, 26.9%) for females.
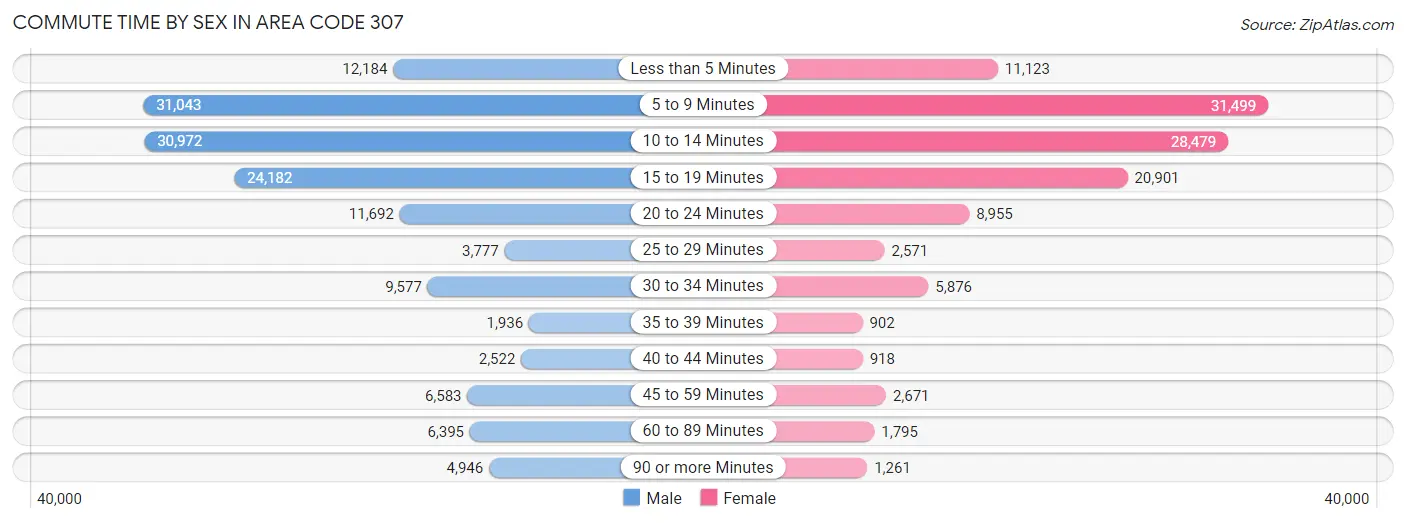
| Commute Time | Male | Female |
| Less than 5 Minutes | 12,184 (8.4%) | 11,123 (9.5%) |
| 5 to 9 Minutes | 31,043 (21.3%) | 31,499 (26.9%) |
| 10 to 14 Minutes | 30,972 (21.2%) | 28,479 (24.3%) |
| 15 to 19 Minutes | 24,182 (16.6%) | 20,901 (17.9%) |
| 20 to 24 Minutes | 11,692 (8.0%) | 8,955 (7.7%) |
| 25 to 29 Minutes | 3,777 (2.6%) | 2,571 (2.2%) |
| 30 to 34 Minutes | 9,577 (6.6%) | 5,876 (5.0%) |
| 35 to 39 Minutes | 1,936 (1.3%) | 902 (0.8%) |
| 40 to 44 Minutes | 2,522 (1.7%) | 918 (0.8%) |
| 45 to 59 Minutes | 6,583 (4.5%) | 2,671 (2.3%) |
| 60 to 89 Minutes | 6,395 (4.4%) | 1,795 (1.5%) |
| 90 or more Minutes | 4,946 (3.4%) | 1,261 (1.1%) |
Time of Departure to Work by Sex in Area Code 307
The most frequent times of departure to work in Area Code 307 are 7:30 AM to 7:59 AM (21,160, 14.5%) for males and 7:30 AM to 7:59 AM (25,159, 21.5%) for females.
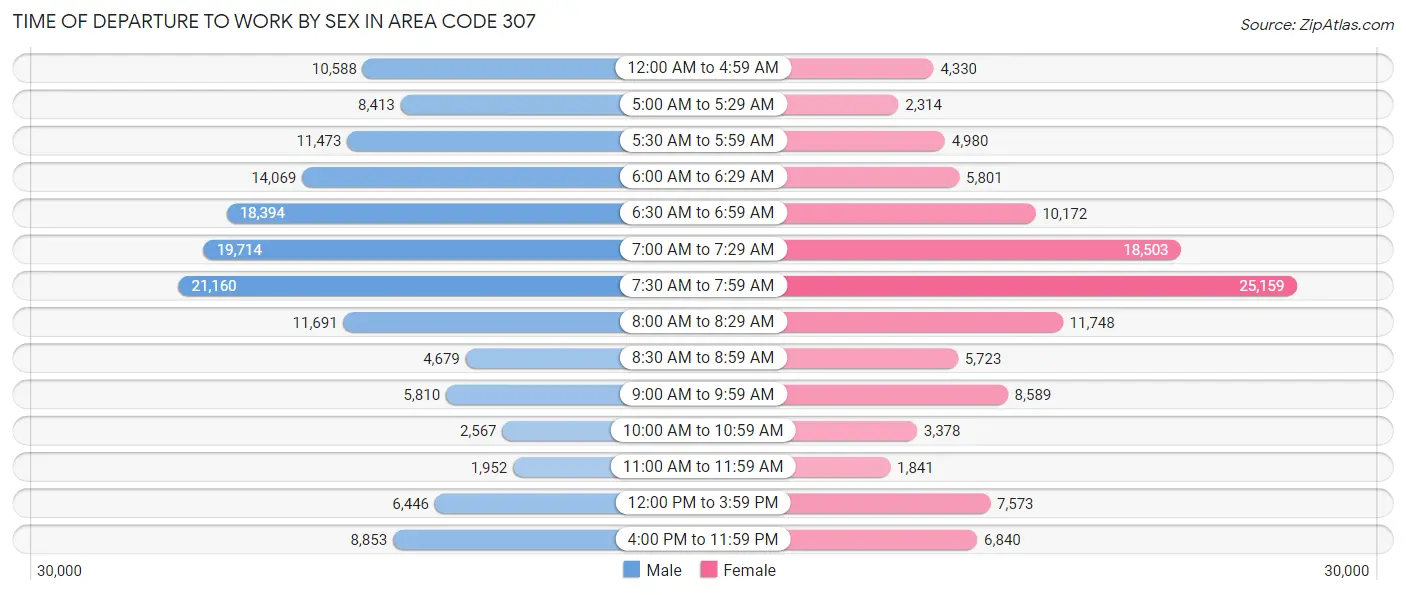
| Time of Departure | Male | Female |
| 12:00 AM to 4:59 AM | 10,588 (7.3%) | 4,330 (3.7%) |
| 5:00 AM to 5:29 AM | 8,413 (5.8%) | 2,314 (2.0%) |
| 5:30 AM to 5:59 AM | 11,473 (7.9%) | 4,980 (4.3%) |
| 6:00 AM to 6:29 AM | 14,069 (9.7%) | 5,801 (5.0%) |
| 6:30 AM to 6:59 AM | 18,394 (12.6%) | 10,172 (8.7%) |
| 7:00 AM to 7:29 AM | 19,714 (13.5%) | 18,503 (15.8%) |
| 7:30 AM to 7:59 AM | 21,160 (14.5%) | 25,159 (21.5%) |
| 8:00 AM to 8:29 AM | 11,691 (8.0%) | 11,748 (10.1%) |
| 8:30 AM to 8:59 AM | 4,679 (3.2%) | 5,723 (4.9%) |
| 9:00 AM to 9:59 AM | 5,810 (4.0%) | 8,589 (7.3%) |
| 10:00 AM to 10:59 AM | 2,567 (1.8%) | 3,378 (2.9%) |
| 11:00 AM to 11:59 AM | 1,952 (1.3%) | 1,841 (1.6%) |
| 12:00 PM to 3:59 PM | 6,446 (4.4%) | 7,573 (6.5%) |
| 4:00 PM to 11:59 PM | 8,853 (6.1%) | 6,840 (5.9%) |
| Total | 145,809 (100.0%) | 116,951 (100.0%) |
Housing Occupancy in Area Code 307
Occupancy by Ownership in Area Code 307
Of the total 234,155 dwellings in Area Code 307, owner-occupied units account for 168,373 (71.9%), while renter-occupied units make up 65,782 (28.1%).
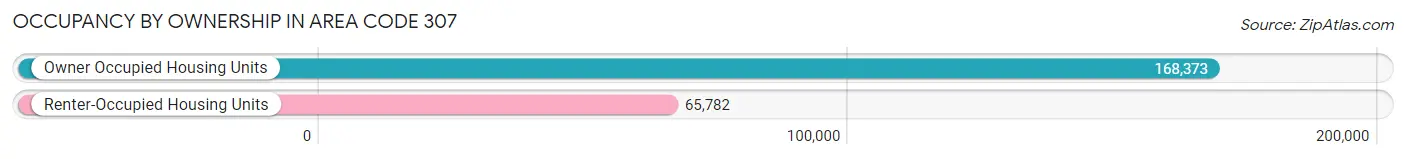
| Occupancy | # Housing Units | % Housing Units |
| Owner Occupied Housing Units | 168,373 | 71.9% |
| Renter-Occupied Housing Units | 65,782 | 28.1% |
| Total Occupied Housing Units | 234,155 | 100.0% |
Occupancy by Household Size in Area Code 307
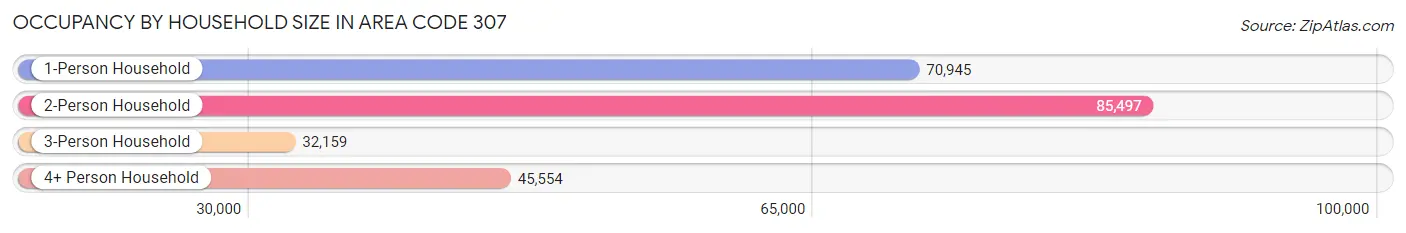
| Household Size | # Housing Units | % Housing Units |
| 1-Person Household | 70,945 | 30.3% |
| 2-Person Household | 85,497 | 36.5% |
| 3-Person Household | 32,159 | 13.7% |
| 4+ Person Household | 45,554 | 19.5% |
| Total Housing Units | 234,155 | 100.0% |
Occupancy by Ownership by Household Size in Area Code 307
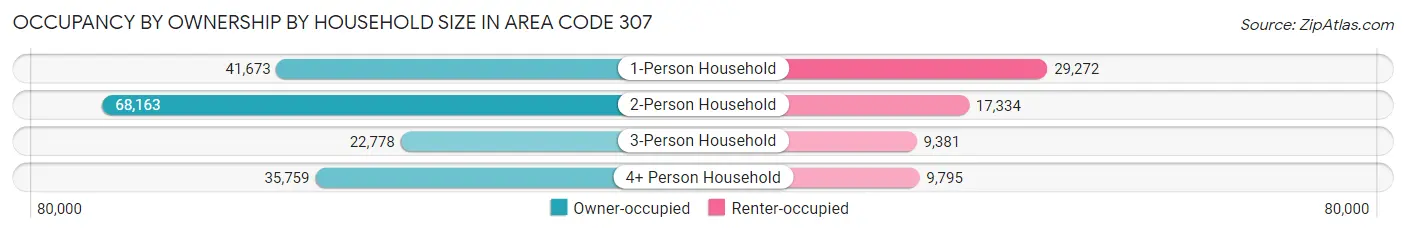
| Household Size | Owner-occupied | Renter-occupied |
| 1-Person Household | 41,673 (58.7%) | 29,272 (41.3%) |
| 2-Person Household | 68,163 (79.7%) | 17,334 (20.3%) |
| 3-Person Household | 22,778 (70.8%) | 9,381 (29.2%) |
| 4+ Person Household | 35,759 (78.5%) | 9,795 (21.5%) |
| Total Housing Units | 168,373 (71.9%) | 65,782 (28.1%) |
Occupancy by Educational Attainment in Area Code 307
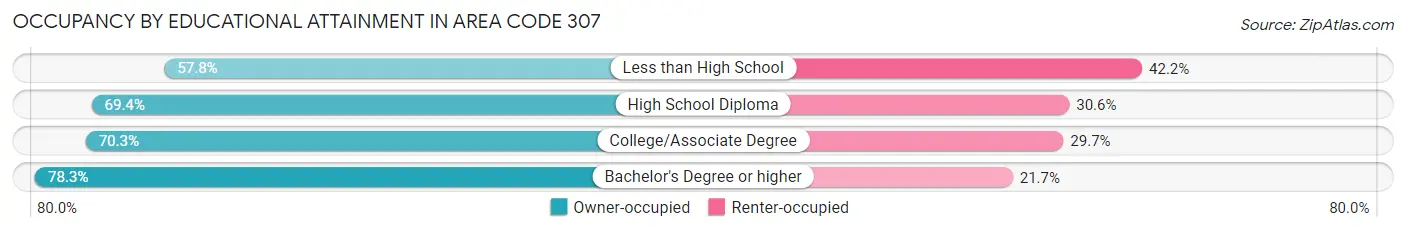
| Household Size | Owner-occupied | Renter-occupied |
| Less than High School | 6,631 (57.8%) | 4,837 (42.2%) |
| High School Diploma | 40,958 (69.4%) | 18,082 (30.6%) |
| College/Associate Degree | 64,795 (70.3%) | 27,378 (29.7%) |
| Bachelor's Degree or higher | 55,989 (78.3%) | 15,485 (21.7%) |
Occupancy by Age of Householder in Area Code 307
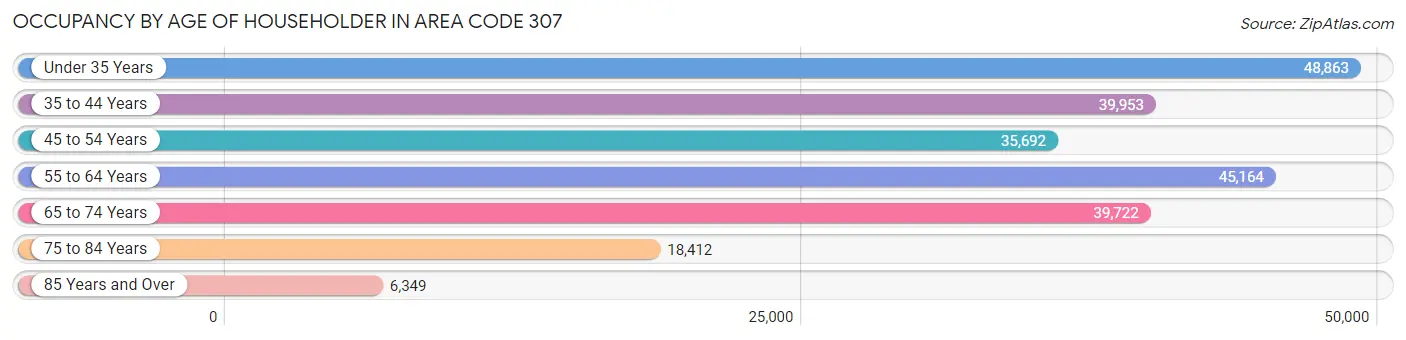
| Age Bracket | # Households | % Households |
| Under 35 Years | 48,863 | 20.9% |
| 35 to 44 Years | 39,953 | 17.1% |
| 45 to 54 Years | 35,692 | 15.2% |
| 55 to 64 Years | 45,164 | 19.3% |
| 65 to 74 Years | 39,722 | 17.0% |
| 75 to 84 Years | 18,412 | 7.9% |
| 85 Years and Over | 6,349 | 2.7% |
| Total | 234,155 | 100.0% |
Housing Finances in Area Code 307
Median Income by Occupancy in Area Code 307
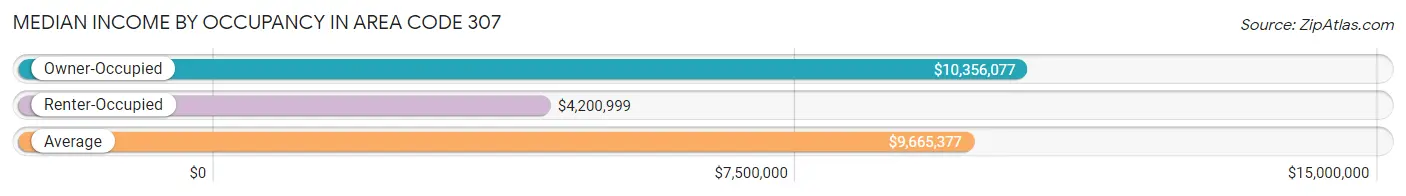
| Occupancy Type | # Households | Median Income |
| Owner-Occupied | 168,373 (71.9%) | $10,356,077 |
| Renter-Occupied | 65,782 (28.1%) | $4,200,999 |
| Average | 234,155 (100.0%) | $9,665,377 |
Occupancy by Householder Income Bracket in Area Code 307
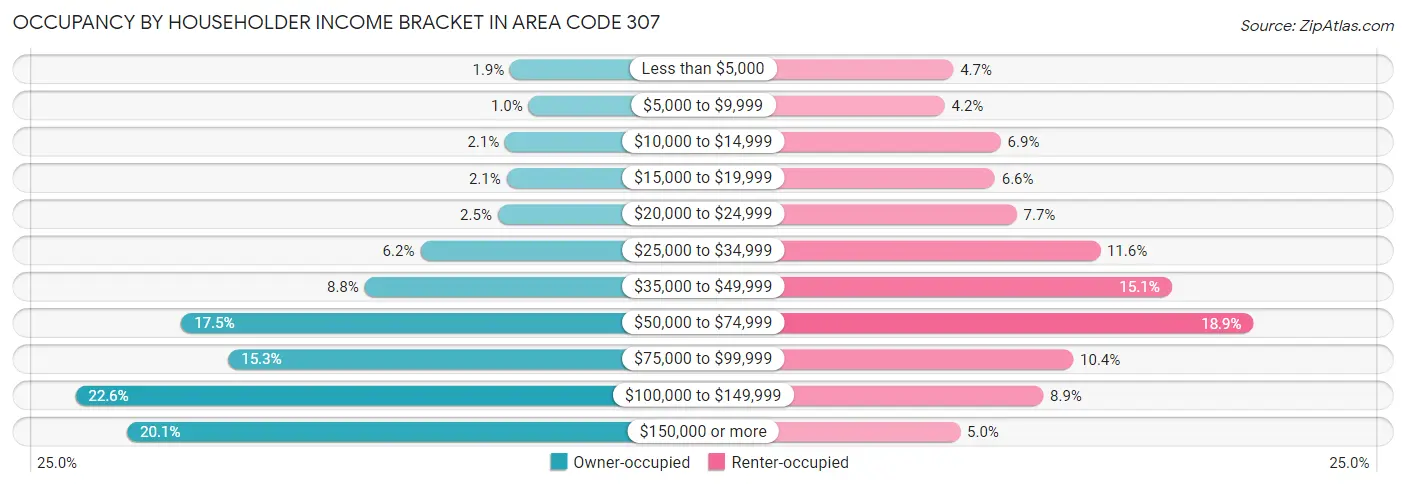
| Income Bracket | Owner-occupied | Renter-occupied |
| Less than $5,000 | 3,158 (1.9%) | 3,059 (4.6%) |
| $5,000 to $9,999 | 1,677 (1.0%) | 2,788 (4.2%) |
| $10,000 to $14,999 | 3,562 (2.1%) | 4,546 (6.9%) |
| $15,000 to $19,999 | 3,446 (2.1%) | 4,360 (6.6%) |
| $20,000 to $24,999 | 4,152 (2.5%) | 5,048 (7.7%) |
| $25,000 to $34,999 | 10,371 (6.2%) | 7,657 (11.6%) |
| $35,000 to $49,999 | 14,831 (8.8%) | 9,899 (15.0%) |
| $50,000 to $74,999 | 29,525 (17.5%) | 12,456 (18.9%) |
| $75,000 to $99,999 | 25,768 (15.3%) | 6,817 (10.4%) |
| $100,000 to $149,999 | 38,013 (22.6%) | 5,875 (8.9%) |
| $150,000 or more | 33,870 (20.1%) | 3,277 (5.0%) |
| Total | 168,373 (100.0%) | 65,782 (100.0%) |
Monthly Housing Cost Tiers in Area Code 307
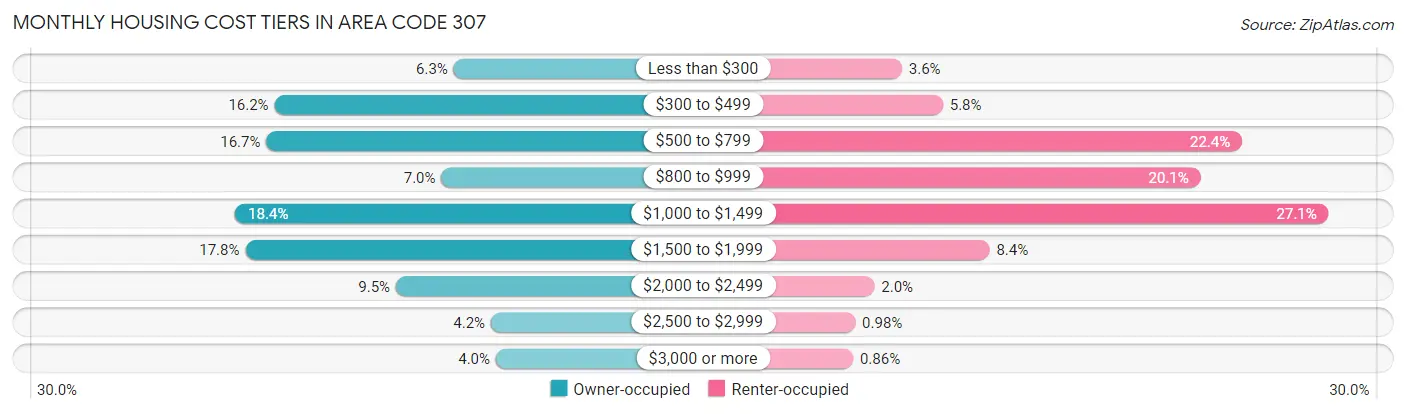
| Monthly Cost | Owner-occupied | Renter-occupied |
| Less than $300 | 10,609 (6.3%) | 2,339 (3.6%) |
| $300 to $499 | 27,272 (16.2%) | 3,827 (5.8%) |
| $500 to $799 | 28,037 (16.7%) | 14,705 (22.4%) |
| $800 to $999 | 11,750 (7.0%) | 13,198 (20.1%) |
| $1,000 to $1,499 | 30,938 (18.4%) | 17,848 (27.1%) |
| $1,500 to $1,999 | 29,980 (17.8%) | 5,526 (8.4%) |
| $2,000 to $2,499 | 15,975 (9.5%) | 1,339 (2.0%) |
| $2,500 to $2,999 | 7,135 (4.2%) | 642 (1.0%) |
| $3,000 or more | 6,677 (4.0%) | 567 (0.9%) |
| Total | 168,373 (100.0%) | 65,782 (100.0%) |
Physical Housing Characteristics in Area Code 307
Housing Structures in Area Code 307
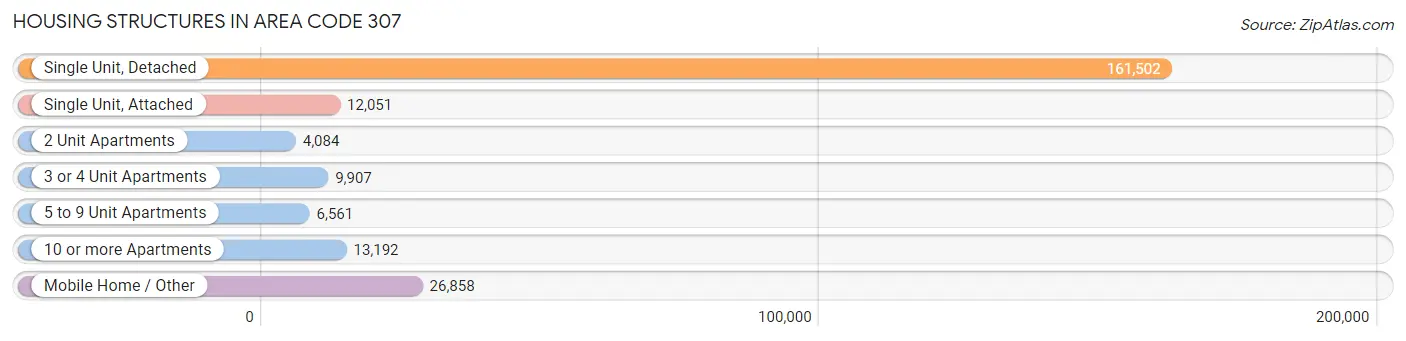
| Structure Type | # Housing Units | % Housing Units |
| Single Unit, Detached | 161,502 | 69.0% |
| Single Unit, Attached | 12,051 | 5.1% |
| 2 Unit Apartments | 4,084 | 1.7% |
| 3 or 4 Unit Apartments | 9,907 | 4.2% |
| 5 to 9 Unit Apartments | 6,561 | 2.8% |
| 10 or more Apartments | 13,192 | 5.6% |
| Mobile Home / Other | 26,858 | 11.5% |
| Total | 234,155 | 100.0% |
Housing Structures by Occupancy in Area Code 307
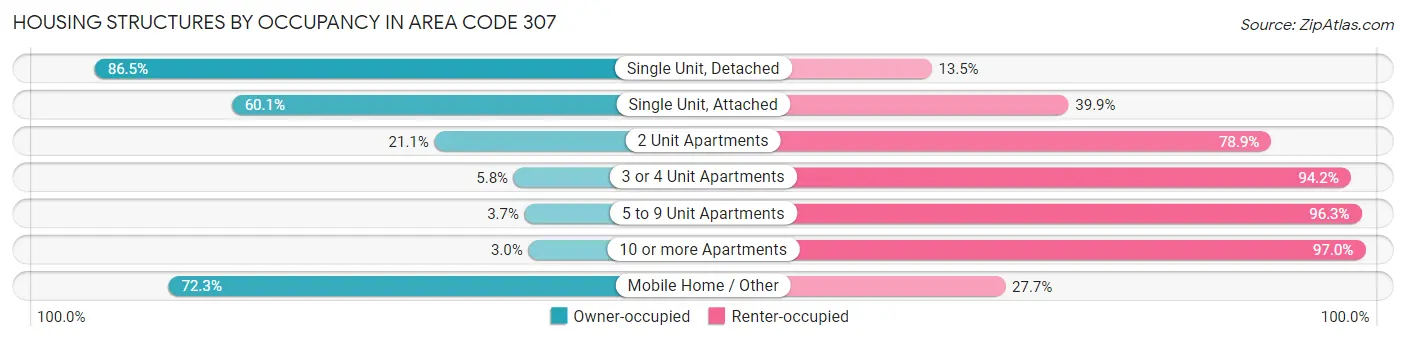
| Structure Type | Owner-occupied | Renter-occupied |
| Single Unit, Detached | 139,646 (86.5%) | 21,856 (13.5%) |
| Single Unit, Attached | 7,244 (60.1%) | 4,807 (39.9%) |
| 2 Unit Apartments | 860 (21.1%) | 3,224 (78.9%) |
| 3 or 4 Unit Apartments | 573 (5.8%) | 9,334 (94.2%) |
| 5 to 9 Unit Apartments | 243 (3.7%) | 6,318 (96.3%) |
| 10 or more Apartments | 392 (3.0%) | 12,800 (97.0%) |
| Mobile Home / Other | 19,415 (72.3%) | 7,443 (27.7%) |
| Total | 168,373 (71.9%) | 65,782 (28.1%) |
Housing Structures by Number of Rooms in Area Code 307
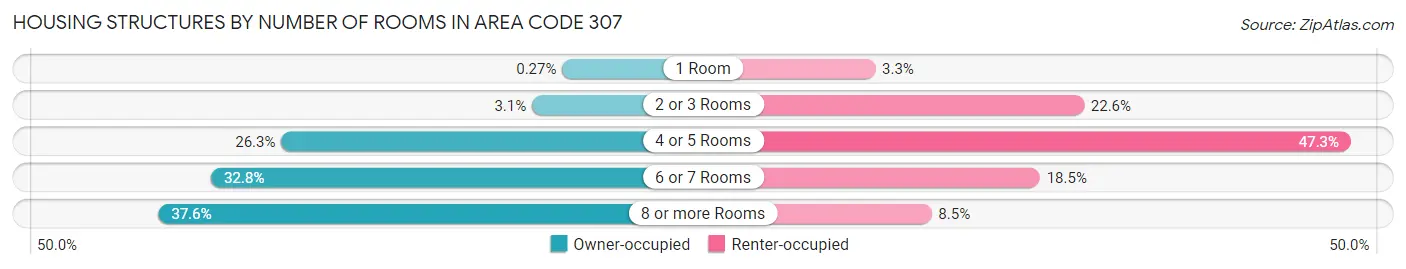
| Number of Rooms | Owner-occupied | Renter-occupied |
| 1 Room | 461 (0.3%) | 2,137 (3.3%) |
| 2 or 3 Rooms | 5,177 (3.1%) | 14,842 (22.6%) |
| 4 or 5 Rooms | 44,208 (26.3%) | 31,080 (47.2%) |
| 6 or 7 Rooms | 55,161 (32.8%) | 12,157 (18.5%) |
| 8 or more Rooms | 63,366 (37.6%) | 5,566 (8.5%) |
| Total | 168,373 (100.0%) | 65,782 (100.0%) |
Housing Structure by Heating Type in Area Code 307
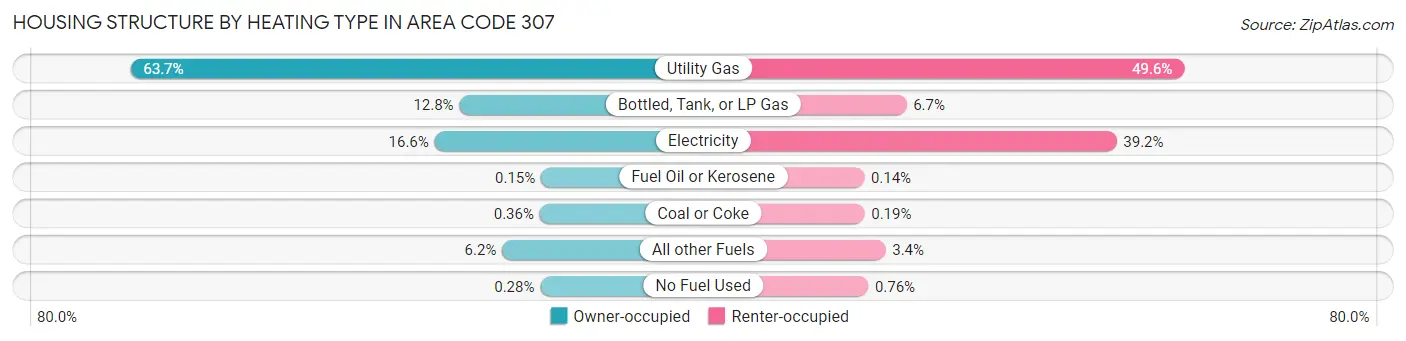
| Heating Type | Owner-occupied | Renter-occupied |
| Utility Gas | 107,170 (63.6%) | 32,654 (49.6%) |
| Bottled, Tank, or LP Gas | 21,521 (12.8%) | 4,389 (6.7%) |
| Electricity | 27,978 (16.6%) | 25,758 (39.2%) |
| Fuel Oil or Kerosene | 254 (0.2%) | 93 (0.1%) |
| Coal or Coke | 611 (0.4%) | 127 (0.2%) |
| All other Fuels | 10,372 (6.2%) | 2,261 (3.4%) |
| No Fuel Used | 467 (0.3%) | 500 (0.8%) |
| Total | 168,373 (100.0%) | 65,782 (100.0%) |
Household Vehicle Usage in Area Code 307
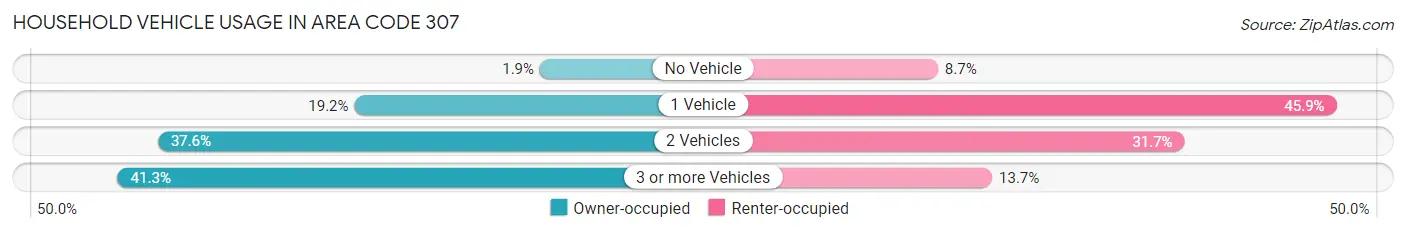
| Vehicles per Household | Owner-occupied | Renter-occupied |
| No Vehicle | 3,193 (1.9%) | 5,709 (8.7%) |
| 1 Vehicle | 32,361 (19.2%) | 30,184 (45.9%) |
| 2 Vehicles | 63,262 (37.6%) | 20,848 (31.7%) |
| 3 or more Vehicles | 69,557 (41.3%) | 9,041 (13.7%) |
| Total | 168,373 (100.0%) | 65,782 (100.0%) |
Real Estate & Mortgages in Area Code 307
Real Estate and Mortgage Overview in Area Code 307
| Characteristic | Without Mortgage | With Mortgage |
| Housing Units | 70,675 | 97,698 |
| Median Property Value | $32,017,002 | $29,649,900 |
| Median Household Income | $7,787,964 | $22,927 |
| Monthly Housing Costs | $59,232 | $6,337 |
| Real Estate Taxes | $152,277 | $2,265 |
Property Value by Mortgage Status in Area Code 307
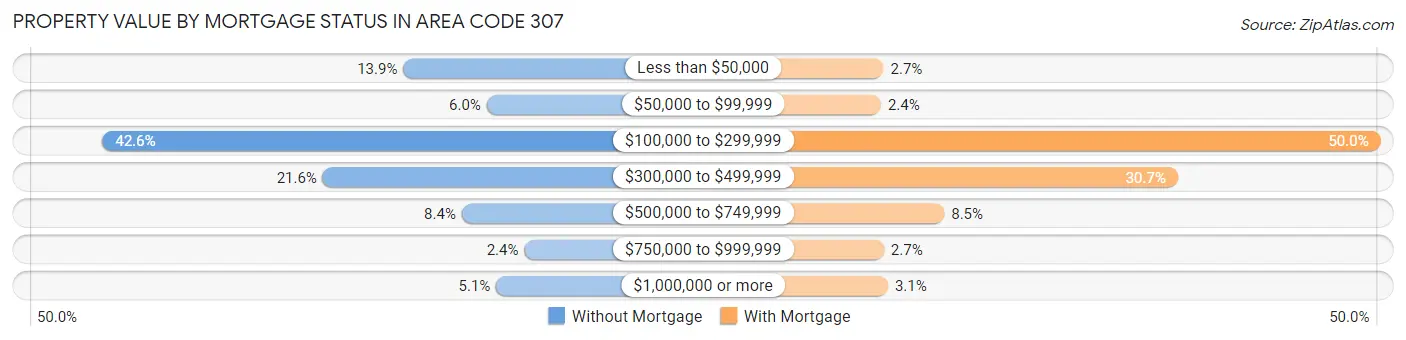
| Property Value | Without Mortgage | With Mortgage |
| Less than $50,000 | 9,851 (13.9%) | 2,607 (2.7%) |
| $50,000 to $99,999 | 4,230 (6.0%) | 2,360 (2.4%) |
| $100,000 to $299,999 | 30,109 (42.6%) | 48,844 (50.0%) |
| $300,000 to $499,999 | 15,271 (21.6%) | 29,977 (30.7%) |
| $500,000 to $749,999 | 5,913 (8.4%) | 8,256 (8.5%) |
| $750,000 to $999,999 | 1,702 (2.4%) | 2,638 (2.7%) |
| $1,000,000 or more | 3,599 (5.1%) | 3,016 (3.1%) |
| Total | 70,675 (100.0%) | 97,698 (100.0%) |
Household Income by Mortgage Status in Area Code 307
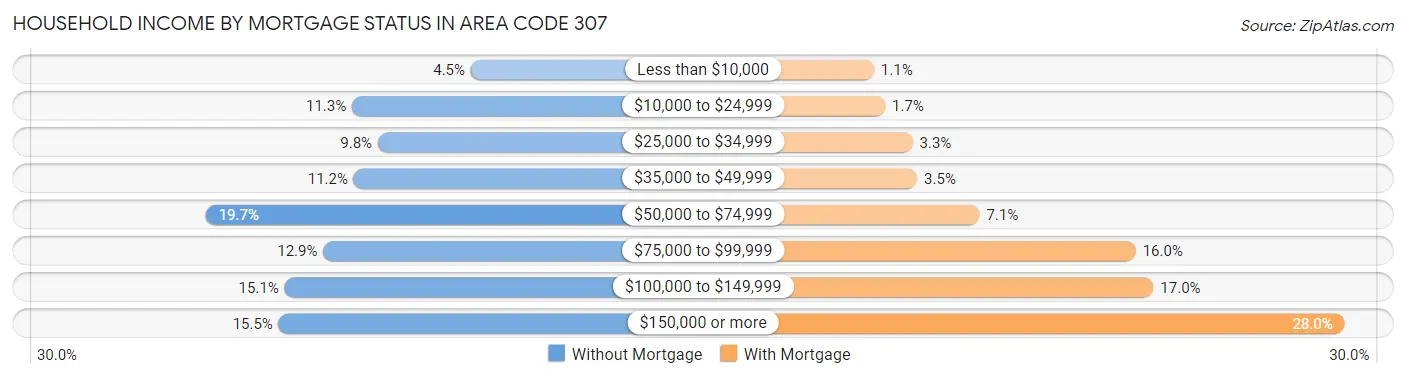
| Household Income | Without Mortgage | With Mortgage |
| Less than $10,000 | 3,181 (4.5%) | 1,028 (1.1%) |
| $10,000 to $24,999 | 7,978 (11.3%) | 1,654 (1.7%) |
| $25,000 to $34,999 | 6,934 (9.8%) | 3,182 (3.3%) |
| $35,000 to $49,999 | 7,909 (11.2%) | 3,437 (3.5%) |
| $50,000 to $74,999 | 13,888 (19.7%) | 6,922 (7.1%) |
| $75,000 to $99,999 | 9,140 (12.9%) | 15,637 (16.0%) |
| $100,000 to $149,999 | 10,702 (15.1%) | 16,628 (17.0%) |
| $150,000 or more | 10,943 (15.5%) | 27,311 (28.0%) |
| Total | 70,675 (100.0%) | 97,698 (100.0%) |
Property Value to Household Income Ratio in Area Code 307
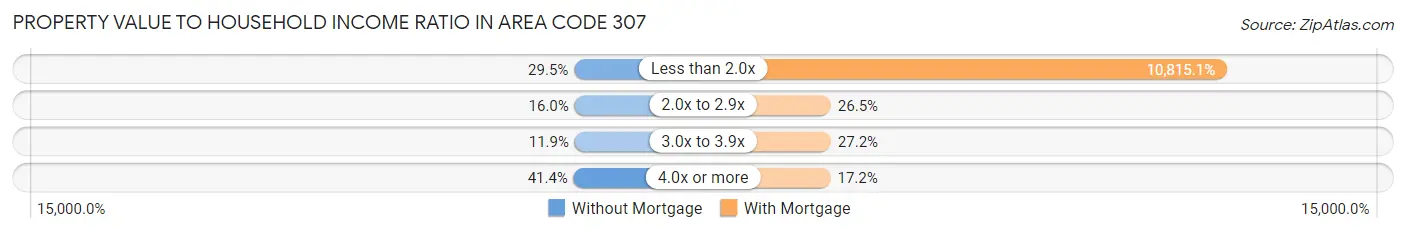
| Value-to-Income Ratio | Without Mortgage | With Mortgage |
| Less than 2.0x | 20,839 (29.5%) | 10,566,177 (10,815.1%) |
| 2.0x to 2.9x | 11,293 (16.0%) | 25,869 (26.5%) |
| 3.0x to 3.9x | 8,376 (11.8%) | 26,522 (27.2%) |
| 4.0x or more | 29,267 (41.4%) | 16,756 (17.2%) |
| Total | 70,675 (100.0%) | 97,698 (100.0%) |
Real Estate Taxes by Mortgage Status in Area Code 307
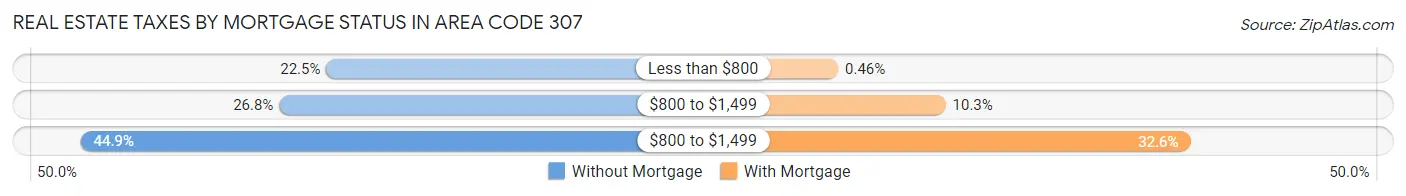
| Property Taxes | Without Mortgage | With Mortgage |
| Less than $800 | 15,867 (22.5%) | 449 (0.5%) |
| $800 to $1,499 | 18,909 (26.8%) | 10,046 (10.3%) |
| $800 to $1,499 | 31,716 (44.9%) | 31,877 (32.6%) |
| Total | 70,675 (100.0%) | 97,698 (100.0%) |
Health & Disability in Area Code 307
Health Insurance Coverage by Age in Area Code 307
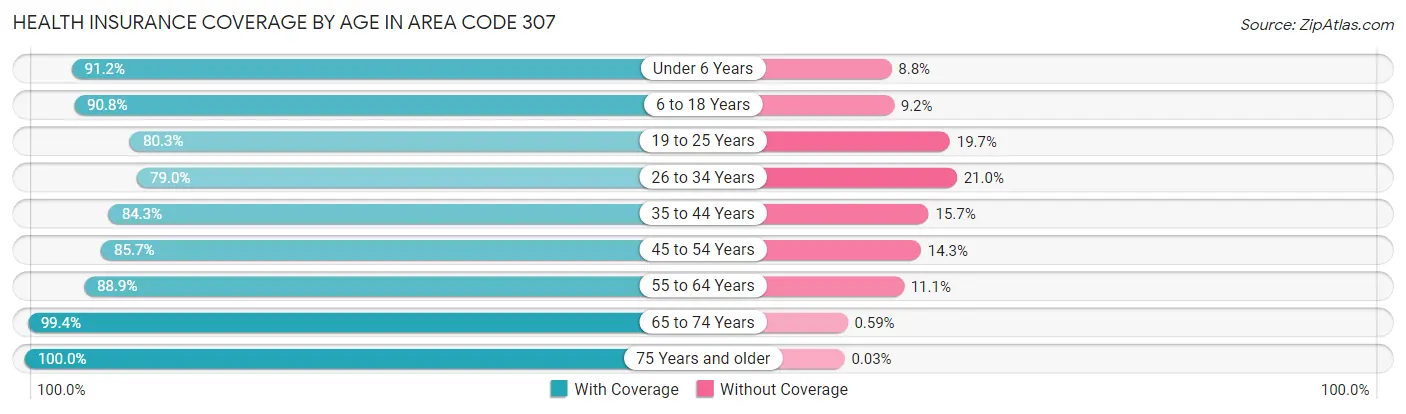
| Age Bracket | With Coverage | Without Coverage |
| Under 6 Years | 36,407 (91.2%) | 3,501 (8.8%) |
| 6 to 18 Years | 91,119 (90.8%) | 9,261 (9.2%) |
| 19 to 25 Years | 40,222 (80.3%) | 9,857 (19.7%) |
| 26 to 34 Years | 51,374 (79.0%) | 13,634 (21.0%) |
| 35 to 44 Years | 62,725 (84.3%) | 11,688 (15.7%) |
| 45 to 54 Years | 55,249 (85.7%) | 9,203 (14.3%) |
| 55 to 64 Years | 66,967 (88.9%) | 8,348 (11.1%) |
| 65 to 74 Years | 61,796 (99.4%) | 368 (0.6%) |
| 75 Years and older | 36,144 (100.0%) | 11 (0.0%) |
| Total | 502,003 (88.4%) | 65,871 (11.6%) |
Health Insurance Coverage by Citizenship Status in Area Code 307
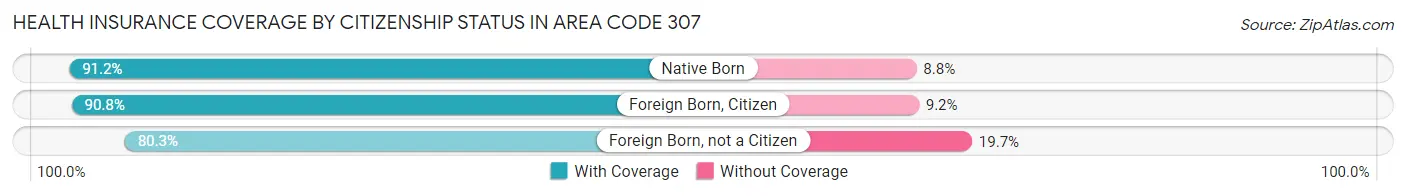
| Citizenship Status | With Coverage | Without Coverage |
| Native Born | 36,407 (91.2%) | 3,501 (8.8%) |
| Foreign Born, Citizen | 91,119 (90.8%) | 9,261 (9.2%) |
| Foreign Born, not a Citizen | 40,222 (80.3%) | 9,857 (19.7%) |
Health Insurance Coverage by Household Income in Area Code 307
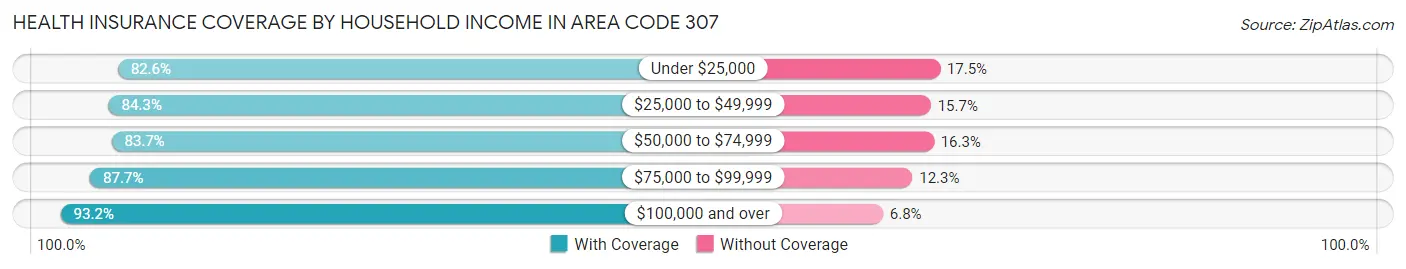
| Household Income | With Coverage | Without Coverage |
| Under $25,000 | 46,178 (82.6%) | 9,763 (17.4%) |
| $25,000 to $49,999 | 68,209 (84.3%) | 12,736 (15.7%) |
| $50,000 to $74,999 | 80,008 (83.7%) | 15,555 (16.3%) |
| $75,000 to $99,999 | 75,958 (87.7%) | 10,619 (12.3%) |
| $100,000 and over | 226,235 (93.2%) | 16,392 (6.8%) |
Public vs Private Health Insurance Coverage by Age in Area Code 307
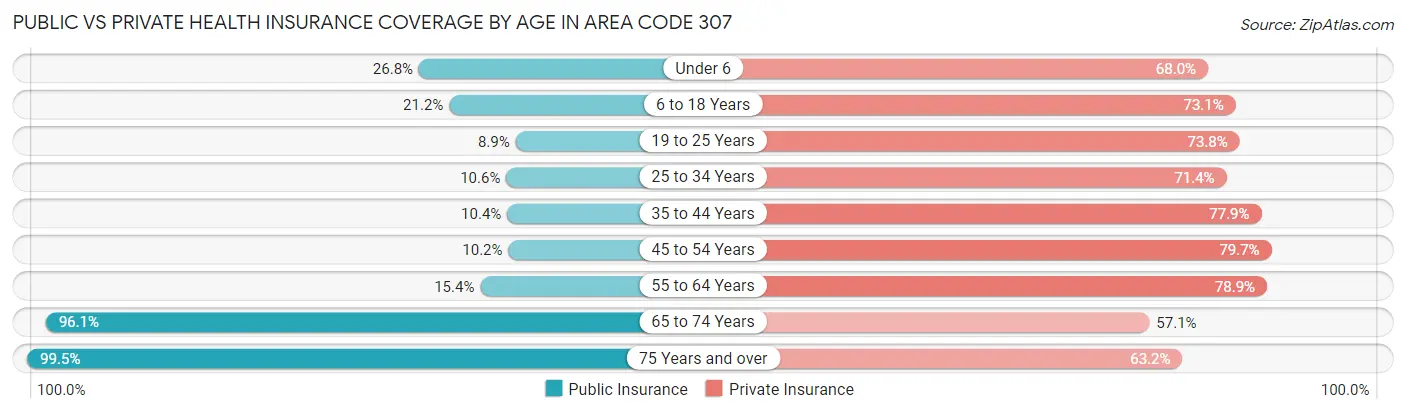
| Age Bracket | Public Insurance | Private Insurance |
| Under 6 | 10,698 (26.8%) | 27,119 (67.9%) |
| 6 to 18 Years | 21,281 (21.2%) | 73,360 (73.1%) |
| 19 to 25 Years | 4,443 (8.9%) | 36,971 (73.8%) |
| 25 to 34 Years | 6,889 (10.6%) | 46,406 (71.4%) |
| 35 to 44 Years | 7,764 (10.4%) | 57,945 (77.9%) |
| 45 to 54 Years | 6,582 (10.2%) | 51,396 (79.7%) |
| 55 to 64 Years | 11,623 (15.4%) | 59,428 (78.9%) |
| 65 to 74 Years | 59,729 (96.1%) | 35,494 (57.1%) |
| 75 Years and over | 35,989 (99.5%) | 22,853 (63.2%) |
| Total | 164,998 (29.1%) | 410,972 (72.4%) |
Disability Status by Sex by Age in Area Code 307
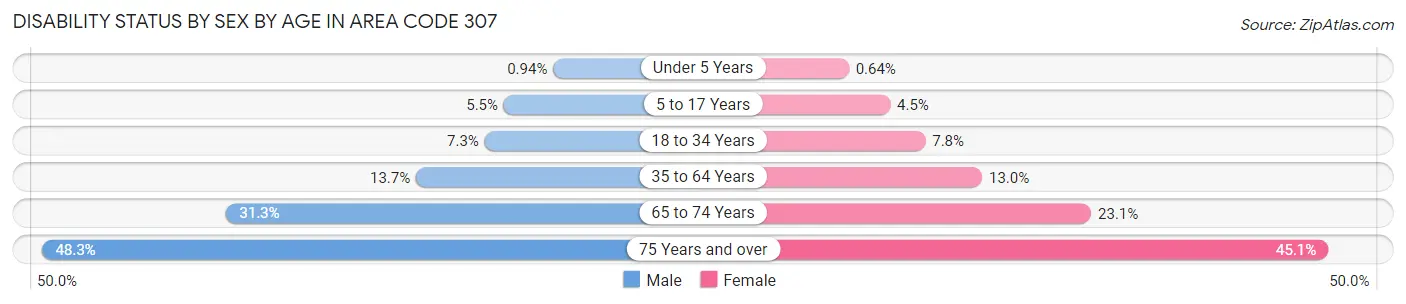
| Age Bracket | Male | Female |
| Under 5 Years | 158 (0.9%) | 103 (0.6%) |
| 5 to 17 Years | 2,808 (5.5%) | 2,159 (4.5%) |
| 18 to 34 Years | 4,669 (7.3%) | 4,615 (7.7%) |
| 35 to 64 Years | 14,942 (13.7%) | 13,652 (13.0%) |
| 65 to 74 Years | 9,873 (31.3%) | 7,079 (23.1%) |
| 75 Years and over | 7,914 (48.3%) | 8,928 (45.1%) |
Disability Class by Sex by Age in Area Code 307
Disability Class: Hearing Difficulty
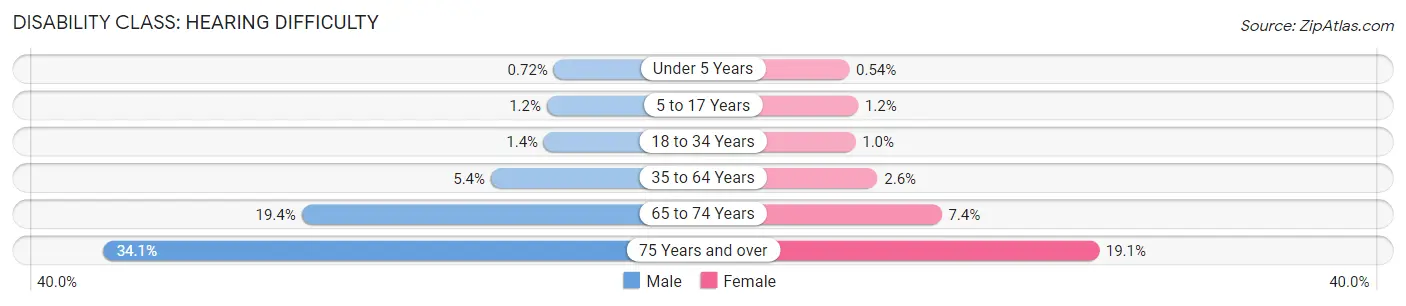
| Age Bracket | Male | Female |
| Under 5 Years | 121 (0.7%) | 87 (0.5%) |
| 5 to 17 Years | 627 (1.2%) | 578 (1.2%) |
| 18 to 34 Years | 924 (1.4%) | 595 (1.0%) |
| 35 to 64 Years | 5,877 (5.4%) | 2,770 (2.6%) |
| 65 to 74 Years | 6,136 (19.4%) | 2,264 (7.4%) |
| 75 Years and over | 5,585 (34.1%) | 3,775 (19.1%) |
Disability Class: Vision Difficulty
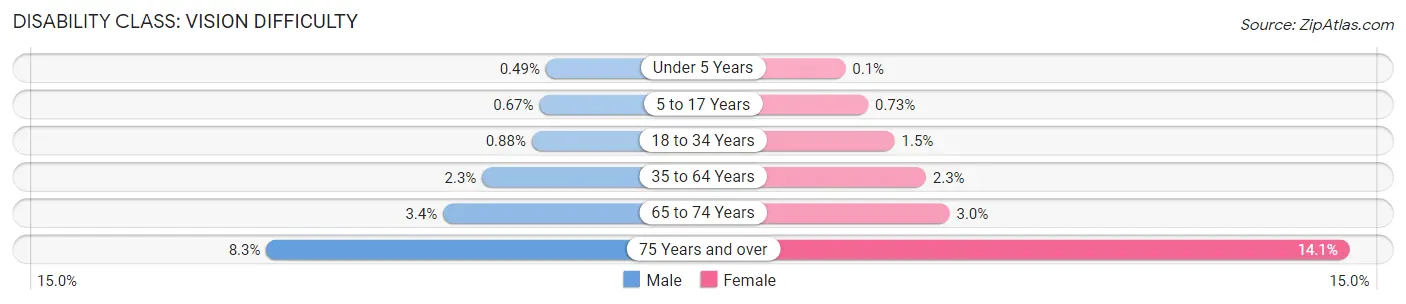
| Age Bracket | Male | Female |
| Under 5 Years | 83 (0.5%) | 16 (0.1%) |
| 5 to 17 Years | 339 (0.7%) | 353 (0.7%) |
| 18 to 34 Years | 565 (0.9%) | 876 (1.5%) |
| 35 to 64 Years | 2,476 (2.3%) | 2,450 (2.3%) |
| 65 to 74 Years | 1,059 (3.4%) | 919 (3.0%) |
| 75 Years and over | 1,354 (8.3%) | 2,797 (14.1%) |
Disability Class: Cognitive Difficulty
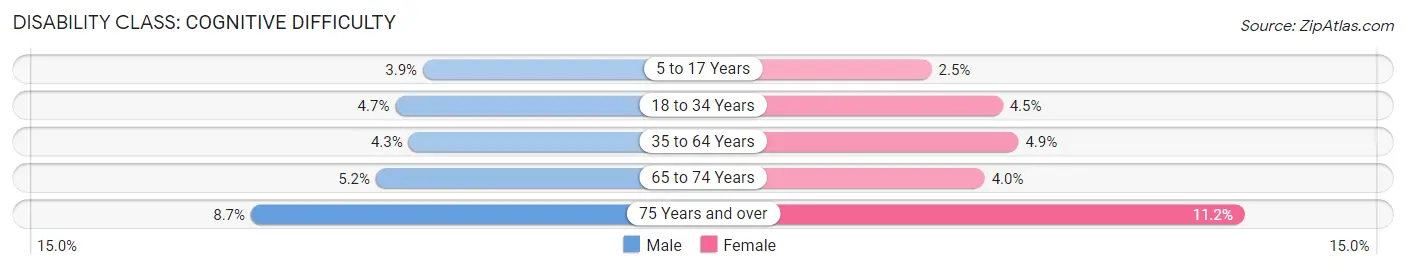
| Age Bracket | Male | Female |
| 5 to 17 Years | 1,990 (3.9%) | 1,205 (2.5%) |
| 18 to 34 Years | 2,992 (4.7%) | 2,665 (4.5%) |
| 35 to 64 Years | 4,709 (4.3%) | 5,159 (4.9%) |
| 65 to 74 Years | 1,649 (5.2%) | 1,218 (4.0%) |
| 75 Years and over | 1,424 (8.7%) | 2,220 (11.2%) |
Disability Class: Ambulatory Difficulty
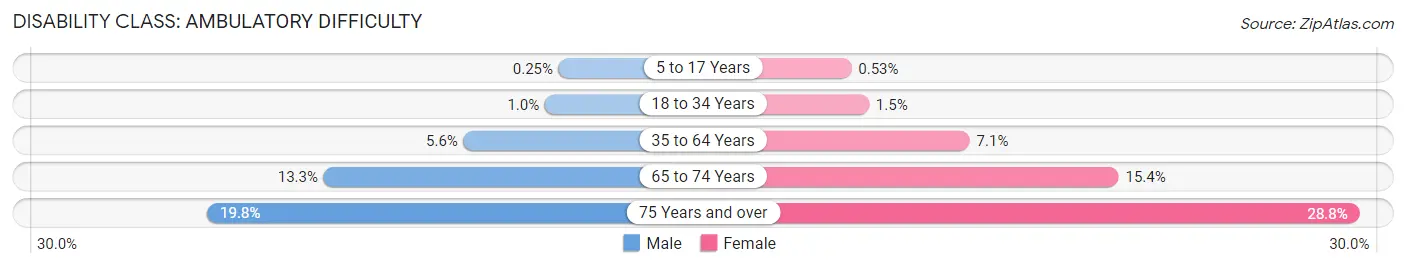
| Age Bracket | Male | Female |
| 5 to 17 Years | 126 (0.3%) | 257 (0.5%) |
| 18 to 34 Years | 650 (1.0%) | 901 (1.5%) |
| 35 to 64 Years | 6,070 (5.6%) | 7,468 (7.1%) |
| 65 to 74 Years | 4,210 (13.3%) | 4,715 (15.4%) |
| 75 Years and over | 3,247 (19.8%) | 5,705 (28.8%) |
Disability Class: Self-Care Difficulty
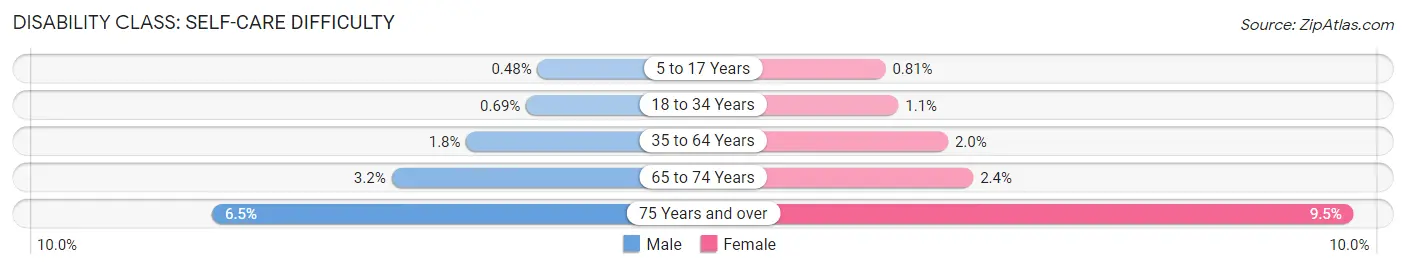
| Age Bracket | Male | Female |
| 5 to 17 Years | 244 (0.5%) | 389 (0.8%) |
| 18 to 34 Years | 444 (0.7%) | 627 (1.1%) |
| 35 to 64 Years | 1,965 (1.8%) | 2,061 (2.0%) |
| 65 to 74 Years | 1,006 (3.2%) | 745 (2.4%) |
| 75 Years and over | 1,068 (6.5%) | 1,880 (9.5%) |
Technology Access in Area Code 307
Computing Device Access in Area Code 307
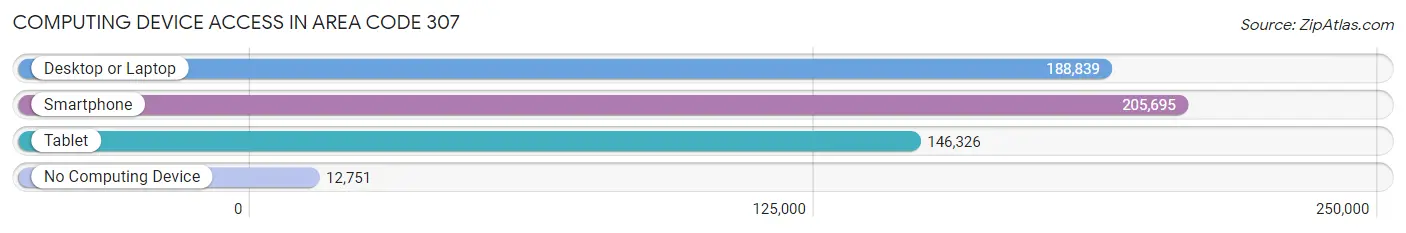
| Device Type | # Households | % Households |
| Desktop or Laptop | 188,839 | 80.6% |
| Smartphone | 205,695 | 87.8% |
| Tablet | 146,326 | 62.5% |
| No Computing Device | 12,751 | 5.4% |
| Total | 234,155 | 100.0% |
Internet Access in Area Code 307
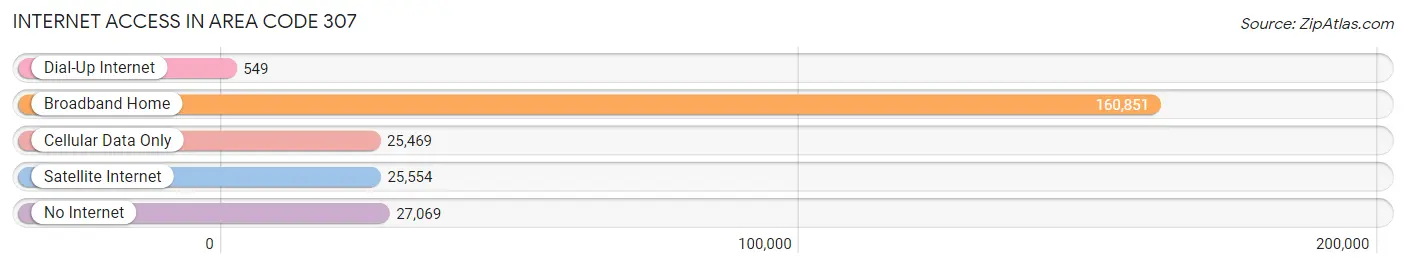
| Internet Type | # Households | % Households |
| Dial-Up Internet | 549 | 0.2% |
| Broadband Home | 160,851 | 68.7% |
| Cellular Data Only | 25,469 | 10.9% |
| Satellite Internet | 25,554 | 10.9% |
| No Internet | 27,069 | 11.6% |
| Total | 234,155 | 100.0% |
Area Code 307 Summary
Geography
Area code 307 is located in the state of Wyoming. It covers the entire state, including the cities of Cheyenne, Casper, and Laramie.
Social
Area code 307 is home to a variety of cultures and lifestyles. The state of Wyoming is known for its cowboy culture, and the area code is home to many people who embrace this lifestyle.
Economics
Area code 307 is home to a variety of industries, including energy, agriculture, and tourism. The state of Wyoming is known for its natural resources, and the area code is home to many businesses that rely on these resources.
Demographics
Area code 307 is home to a diverse population. The state of Wyoming has a population of approximately 579,000 people, and the area code is home to a variety of ethnicities, religions, and ages.
Common Questions
What is Per Capita Income in Area Code 307?
Per Capita income in Area Code 307 is $41,764.
What is the Median Family Income in Area Code 307?
Median Family Income in Area Code 307 is $90,545.
What is the Median Household income in Area Code 307?
Median Household Income in Area Code 307 is $76,105.
What is Income or Wage Gap in Area Code 307?
Income or Wage Gap in Area Code 307 is 41.3%.
Women in Area Code 307 earn 58.7 cents for every dollar earned by a man.
What is Family Income Deficit in Area Code 307?
Family Income Deficit in Area Code 307 is $10,022.
Families that are below poverty line in Area Code 307 earn $10,022 less on average than the poverty threshold level.
What is Inequality or Gini Index in Area Code 307?
Inequality or Gini Index in Area Code 307 is 58.01.
What is the Total Population of Area Code 307?
Total Population of Area Code 307 is 577,977.
What is the Total Male Population of Area Code 307?
Total Male Population of Area Code 307 is 295,823.
What is the Total Female Population of Area Code 307?
Total Female Population of Area Code 307 is 282,154.
What is the Ratio of Males per 100 Females in Area Code 307?
There are 104.84 Males per 100 Females in Area Code 307.
What is the Ratio of Females per 100 Males in Area Code 307?
There are 95.38 Females per 100 Males in Area Code 307.
What is the Median Population Age in Area Code 307?
Median Population Age in Area Code 307 is 44.8 Years.
What is the Average Family Size in Area Code 307
Average Family Size in Area Code 307 is 2.9 People.
What is the Average Household Size in Area Code 307
Average Household Size in Area Code 307 is 2.5 People.
How Large is the Labor Force in Area Code 307?
There are 294,992 People in the Labor Forcein in Area Code 307.
What is the Percentage of People in the Labor Force in Area Code 307?
64.0% of People are in the Labor Force in Area Code 307.
What is the Unemployment Rate in Area Code 307?
Unemployment Rate in Area Code 307 is 7.2%.