Zip Codes with the Highest Percentage of Population with a Degree in Science and Engineering in Alaska
RELATED REPORTS & OPTIONS
Science and Engineering
Alaska
Compare Zip Codes
Map of Zip Codes with the Highest Percentage of Population with a Degree in Science and Engineering in Alaska
0.0%
100.0%
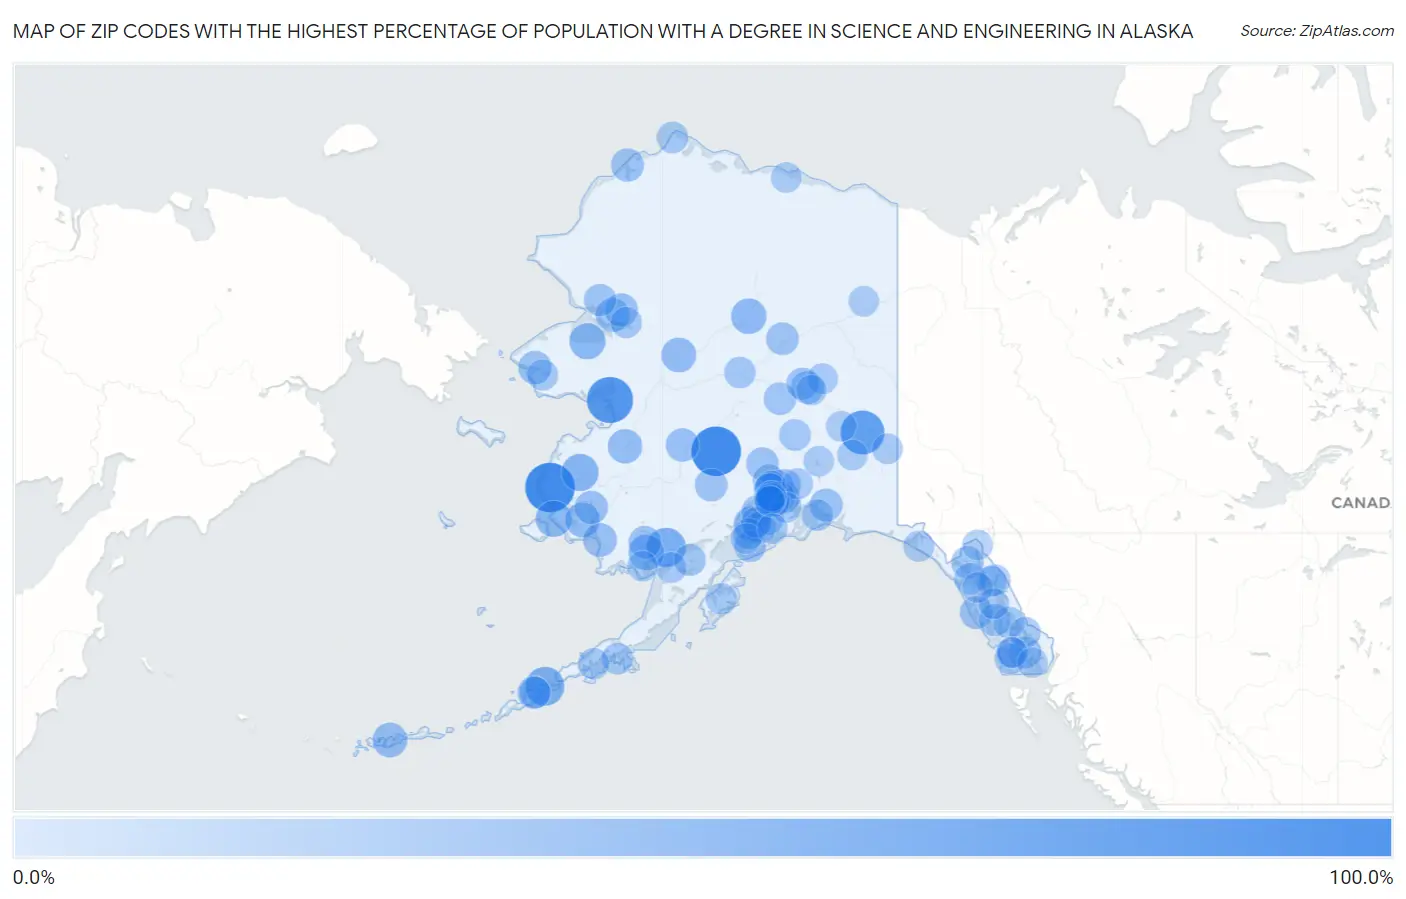
Zip Codes with the Highest Percentage of Population with a Degree in Science and Engineering in Alaska
| Zip Code | % Graduates | vs State | vs National | |
| 1. | 99563 | 100.0% | 10.4% (+89.6)#1 | 9.8% (+90.2)#23 |
| 2. | 99691 | 100.0% | 10.4% (+89.6)#2 | 9.8% (+90.2)#77 |
| 3. | 99771 | 83.3% | 10.4% (+72.9)#3 | 9.8% (+73.6)#122 |
| 4. | 99776 | 71.4% | 10.4% (+61.0)#4 | 9.8% (+61.6)#171 |
| 5. | 99636 | 48.8% | 10.4% (+38.4)#5 | 9.8% (+39.0)#438 |
| 6. | 99553 | 46.3% | 10.4% (+35.8)#6 | 9.8% (+36.5)#484 |
| 7. | 99658 | 38.1% | 10.4% (+27.7)#7 | 9.8% (+28.3)#745 |
| 8. | 99637 | 34.0% | 10.4% (+23.6)#8 | 9.8% (+24.2)#997 |
| 9. | 99736 | 33.3% | 10.4% (+22.9)#9 | 9.8% (+23.6)#1,055 |
| 10. | 99555 | 30.8% | 10.4% (+20.3)#10 | 9.8% (+21.0)#1,248 |
| 11. | 99726 | 30.0% | 10.4% (+19.6)#11 | 9.8% (+20.2)#1,325 |
| 12. | 99610 | 26.7% | 10.4% (+16.2)#12 | 9.8% (+16.9)#1,690 |
| 13. | 99546 | 26.7% | 10.4% (+16.2)#13 | 9.8% (+16.9)#1,697 |
| 14. | 99746 | 26.7% | 10.4% (+16.2)#14 | 9.8% (+16.9)#1,699 |
| 15. | 99559 | 26.5% | 10.4% (+16.1)#15 | 9.8% (+16.7)#1,721 |
| 16. | 99590 | 25.0% | 10.4% (+14.6)#16 | 9.8% (+15.2)#1,986 |
| 17. | 99655 | 22.2% | 10.4% (+11.8)#17 | 9.8% (+12.4)#2,575 |
| 18. | 99763 | 21.4% | 10.4% (+11.0)#18 | 9.8% (+11.6)#2,804 |
| 19. | 99785 | 20.0% | 10.4% (+9.56)#19 | 9.8% (+10.2)#3,348 |
| 20. | 99749 | 20.0% | 10.4% (+9.56)#20 | 9.8% (+10.2)#3,358 |
| 21. | 99609 | 20.0% | 10.4% (+9.56)#21 | 9.8% (+10.2)#3,361 |
| 22. | 99675 | 20.0% | 10.4% (+9.56)#22 | 9.8% (+10.2)#3,390 |
| 23. | 99782 | 19.0% | 10.4% (+8.61)#23 | 9.8% (+9.27)#3,776 |
| 24. | 99835 | 18.0% | 10.4% (+7.52)#24 | 9.8% (+8.18)#4,343 |
| 25. | 99686 | 17.9% | 10.4% (+7.50)#25 | 9.8% (+8.16)#4,357 |
| 26. | 99692 | 17.8% | 10.4% (+7.34)#26 | 9.8% (+8.00)#4,437 |
| 27. | 99576 | 17.5% | 10.4% (+7.04)#27 | 9.8% (+7.70)#4,639 |
| 28. | 99503 | 17.0% | 10.4% (+6.56)#28 | 9.8% (+7.22)#4,947 |
| 29. | 99623 | 16.9% | 10.4% (+6.48)#29 | 9.8% (+7.14)#5,003 |
| 30. | 99705 | 16.9% | 10.4% (+6.41)#30 | 9.8% (+7.07)#5,073 |
| 31. | 99701 | 16.8% | 10.4% (+6.38)#31 | 9.8% (+7.04)#5,092 |
| 32. | 99683 | 16.7% | 10.4% (+6.22)#32 | 9.8% (+6.89)#5,247 |
| 33. | 99760 | 15.7% | 10.4% (+5.24)#33 | 9.8% (+5.90)#5,995 |
| 34. | 99827 | 15.6% | 10.4% (+5.20)#34 | 9.8% (+5.86)#6,050 |
| 35. | 99518 | 15.3% | 10.4% (+4.82)#35 | 9.8% (+5.48)#6,436 |
| 36. | 99752 | 14.5% | 10.4% (+4.05)#36 | 9.8% (+4.71)#7,250 |
| 37. | 99567 | 14.2% | 10.4% (+3.74)#37 | 9.8% (+4.40)#7,648 |
| 38. | 99703 | 14.2% | 10.4% (+3.73)#38 | 9.8% (+4.39)#7,660 |
| 39. | 99572 | 14.0% | 10.4% (+3.59)#39 | 9.8% (+4.25)#7,815 |
| 40. | 99654 | 14.0% | 10.4% (+3.58)#40 | 9.8% (+4.24)#7,832 |
| 41. | 99830 | 13.6% | 10.4% (+3.12)#41 | 9.8% (+3.78)#8,425 |
| 42. | 99611 | 13.0% | 10.4% (+2.53)#42 | 9.8% (+3.19)#9,282 |
| 43. | 99901 | 12.7% | 10.4% (+2.22)#43 | 9.8% (+2.88)#9,767 |
| 44. | 99568 | 12.4% | 10.4% (+1.92)#44 | 9.8% (+2.58)#10,260 |
| 45. | 99645 | 12.4% | 10.4% (+1.91)#45 | 9.8% (+2.57)#10,270 |
| 46. | 99603 | 12.2% | 10.4% (+1.79)#46 | 9.8% (+2.45)#10,474 |
| 47. | 99688 | 12.2% | 10.4% (+1.74)#47 | 9.8% (+2.40)#10,566 |
| 48. | 99613 | 12.1% | 10.4% (+1.65)#48 | 9.8% (+2.31)#10,755 |
| 49. | 99729 | 12.0% | 10.4% (+1.56)#49 | 9.8% (+2.22)#10,904 |
| 50. | 99504 | 11.9% | 10.4% (+1.45)#50 | 9.8% (+2.11)#11,100 |
| 51. | 99685 | 11.8% | 10.4% (+1.36)#51 | 9.8% (+2.02)#11,272 |
| 52. | 99826 | 11.6% | 10.4% (+1.17)#52 | 9.8% (+1.83)#11,633 |
| 53. | 99505 | 11.6% | 10.4% (+1.12)#53 | 9.8% (+1.78)#11,725 |
| 54. | 99574 | 11.5% | 10.4% (+1.07)#54 | 9.8% (+1.73)#11,800 |
| 55. | 99501 | 11.4% | 10.4% (+0.940)#55 | 9.8% (+1.60)#12,070 |
| 56. | 99833 | 11.3% | 10.4% (+0.901)#56 | 9.8% (+1.56)#12,152 |
| 57. | 99723 | 11.3% | 10.4% (+0.874)#57 | 9.8% (+1.53)#12,212 |
| 58. | 99661 | 10.6% | 10.4% (+0.196)#58 | 9.8% (+0.857)#13,661 |
| 59. | 99777 | 10.5% | 10.4% (+0.084)#59 | 9.8% (+0.745)#13,910 |
| 60. | 99507 | 10.4% | 10.4% (-0.014)#60 | 9.8% (+0.646)#14,123 |
| 61. | 99577 | 10.0% | 10.4% (-0.479)#61 | 9.8% (+0.182)#15,116 |
| 62. | 99615 | 9.9% | 10.4% (-0.496)#62 | 9.8% (+0.164)#15,146 |
| 63. | 99516 | 9.8% | 10.4% (-0.687)#63 | 9.8% (-0.027)#15,576 |
| 64. | 99517 | 9.7% | 10.4% (-0.699)#64 | 9.8% (-0.038)#15,608 |
| 65. | 99929 | 9.7% | 10.4% (-0.724)#65 | 9.8% (-0.064)#15,666 |
| 66. | 99770 | 9.5% | 10.4% (-0.918)#66 | 9.8% (-0.258)#16,108 |
| 67. | 99612 | 9.4% | 10.4% (-1.03)#67 | 9.8% (-0.370)#16,367 |
| 68. | 99694 | 9.0% | 10.4% (-1.46)#68 | 9.8% (-0.799)#17,386 |
| 69. | 99639 | 8.9% | 10.4% (-1.56)#69 | 9.8% (-0.903)#17,601 |
| 70. | 99801 | 8.9% | 10.4% (-1.58)#70 | 9.8% (-0.916)#17,633 |
| 71. | 99762 | 8.5% | 10.4% (-1.97)#71 | 9.8% (-1.31)#18,537 |
| 72. | 99652 | 8.3% | 10.4% (-2.11)#72 | 9.8% (-1.45)#18,848 |
| 73. | 99689 | 8.2% | 10.4% (-2.28)#73 | 9.8% (-1.62)#19,286 |
| 74. | 99669 | 8.0% | 10.4% (-2.47)#74 | 9.8% (-1.81)#19,690 |
| 75. | 99556 | 8.0% | 10.4% (-2.47)#75 | 9.8% (-1.81)#19,694 |
| 76. | 99925 | 8.0% | 10.4% (-2.47)#76 | 9.8% (-1.81)#19,699 |
| 77. | 99674 | 7.9% | 10.4% (-2.51)#77 | 9.8% (-1.85)#19,797 |
| 78. | 99922 | 7.9% | 10.4% (-2.55)#78 | 9.8% (-1.89)#19,880 |
| 79. | 99508 | 7.6% | 10.4% (-2.85)#79 | 9.8% (-2.19)#20,533 |
| 80. | 99712 | 7.5% | 10.4% (-2.91)#80 | 9.8% (-2.25)#20,648 |
| 81. | 99633 | 7.5% | 10.4% (-2.92)#81 | 9.8% (-2.25)#20,666 |
| 82. | 99824 | 7.5% | 10.4% (-2.96)#82 | 9.8% (-2.29)#20,757 |
| 83. | 99921 | 7.2% | 10.4% (-3.21)#83 | 9.8% (-2.55)#21,271 |
| 84. | 99764 | 7.1% | 10.4% (-3.30)#84 | 9.8% (-2.64)#21,453 |
| 85. | 99820 | 7.1% | 10.4% (-3.30)#85 | 9.8% (-2.64)#21,454 |
| 86. | 99829 | 6.8% | 10.4% (-3.64)#86 | 9.8% (-2.98)#22,071 |
| 87. | 99586 | 6.7% | 10.4% (-3.70)#87 | 9.8% (-3.04)#22,172 |
| 88. | 99587 | 6.7% | 10.4% (-3.74)#88 | 9.8% (-3.08)#22,223 |
| 89. | 99734 | 6.4% | 10.4% (-4.07)#89 | 9.8% (-3.41)#22,805 |
| 90. | 99502 | 6.4% | 10.4% (-4.08)#90 | 9.8% (-3.42)#22,827 |
| 91. | 99740 | 6.1% | 10.4% (-4.32)#91 | 9.8% (-3.66)#23,252 |
| 92. | 99737 | 6.1% | 10.4% (-4.32)#92 | 9.8% (-3.66)#23,264 |
| 93. | 99506 | 5.9% | 10.4% (-4.53)#93 | 9.8% (-3.87)#23,566 |
| 94. | 99628 | 5.9% | 10.4% (-4.56)#94 | 9.8% (-3.90)#23,629 |
| 95. | 99702 | 5.8% | 10.4% (-4.66)#95 | 9.8% (-4.00)#23,765 |
| 96. | 99588 | 5.8% | 10.4% (-4.66)#96 | 9.8% (-4.00)#23,769 |
| 97. | 99515 | 5.6% | 10.4% (-4.81)#97 | 9.8% (-4.15)#23,967 |
| 98. | 99926 | 5.6% | 10.4% (-4.89)#98 | 9.8% (-4.23)#24,050 |
| 99. | 99664 | 5.5% | 10.4% (-4.92)#99 | 9.8% (-4.26)#24,101 |
| 100. | 99840 | 5.4% | 10.4% (-5.02)#100 | 9.8% (-4.36)#24,219 |
Common Questions
What are the Top 10 Zip Codes with the Highest Percentage of Population with a Degree in Science and Engineering in Alaska?
Top 10 Zip Codes with the Highest Percentage of Population with a Degree in Science and Engineering in Alaska are:
What zip code has the Highest Percentage of Population with a Degree in Science and Engineering in Alaska?
99563 has the Highest Percentage of Population with a Degree in Science and Engineering in Alaska with 100.0%.
What is the Percentage of Population with a Degree in Science and Engineering in the State of Alaska?
Percentage of Population with a Degree in Science and Engineering in Alaska is 10.4%.
What is the Percentage of Population with a Degree in Science and Engineering in the United States?
Percentage of Population with a Degree in Science and Engineering in the United States is 9.8%.