Zip Codes with the Highest Percentage of Tlingit-Haida Population in Alaska

RELATED REPORTS & OPTIONS

Tlingit-Haida
Population
Families and Households
Female Fertility
Female Fertility (Unmarried)
Race (Community Size)
Race (Percentage)
Ancestry (Community Size)
AfghanAfricanAlaska NativeAlaskan AthabascanAlbanianAleutAlsatianAmericanApacheArabArapahoArgentineanArmenianAssyrian / Chaldean / SyriacAustralianAustrianBahamianBangladeshiBarbadianBasqueBelgianBelizeanBermudanBhutaneseBlackfeetBolivianBrazilianBritishBritish West IndianBulgarianBurmeseCajunCambodianCanadianCape VerdeanCarpatho RusynCelticCentral AmericanCentral American IndianCherokeeCheyenneChickasawChileanChineseChippewaChoctawColombianColvilleComancheCosta RicanCreeCreekCroatianCrowCubanCypriotCzechCzechoslovakianDanishDelawareDominicanDutchDutch West IndianEastern EuropeanEcuadorianEgyptianEnglishEstonianEthiopianEuropeanFijianFilipinoFinnishFrenchFrench American IndianFrench CanadianGermanGerman RussianGhanaianGreekGuamanian / ChamorroGuatemalanGuyaneseHaitianHmongHonduranHopiHoumaHungarianIcelanderIndian (Asian)IndonesianInupiatIranianIraqiIrishIroquoisIsraeliItalianJamaicanJapaneseJordanianKenyanKiowaKoreanLaotianLatvianLebaneseLiberianLithuanianLumbeeLuxembourgerMacedonianMalaysianMalteseMarshalleseMenomineeMexicanMexican American IndianMongolianMoroccanNative HawaiianNavajoNepaleseNew ZealanderNicaraguanNigerianNorthern EuropeanNorwegianOkinawanOsageOttawaPaiutePakistaniPalestinianPanamanianParaguayanPennsylvania GermanPeruvianPimaPolishPortuguesePotawatomiPuebloPuerto RicanPuget Sound SalishRomanianRussianSalvadoranSamoanScandinavianScotch-IrishScottishSeminoleSenegaleseSerbianShoshoneSierra LeoneanSiouxSlavicSlovakSloveneSomaliSouth AfricanSouth AmericanSouth American IndianSoviet UnionSpaniardSpanishSpanish AmericanSpanish American IndianSri LankanSubsaharan AfricanSudaneseSwedishSwissSyrianTaiwaneseThaiTlingit-HaidaTohono O'OdhamTonganTrinidadian and TobagonianTsimshianTurkishU.S. Virgin IslanderUgandanUkrainianUruguayanUteVenezuelanVietnameseWelshWest IndianYakamaYaquiYugoslavianYumanYup'ikZimbabwean
Ancestry (Percentage)
AfghanAfricanAlaska NativeAlaskan AthabascanAlbanianAleutAlsatianAmericanApacheArabArapahoArgentineanArmenianAssyrian / Chaldean / SyriacAustralianAustrianBahamianBangladeshiBarbadianBasqueBelgianBelizeanBermudanBhutaneseBlackfeetBolivianBrazilianBritishBritish West IndianBulgarianBurmeseCajunCambodianCanadianCape VerdeanCarpatho RusynCelticCentral AmericanCentral American IndianCherokeeCheyenneChickasawChileanChineseChippewaChoctawColombianColvilleComancheCosta RicanCreeCreekCroatianCrowCubanCypriotCzechCzechoslovakianDanishDelawareDominicanDutchDutch West IndianEastern EuropeanEcuadorianEgyptianEnglishEstonianEthiopianEuropeanFijianFilipinoFinnishFrenchFrench American IndianFrench CanadianGermanGerman RussianGhanaianGreekGuamanian / ChamorroGuatemalanGuyaneseHaitianHmongHonduranHopiHoumaHungarianIcelanderIndian (Asian)IndonesianInupiatIranianIraqiIrishIroquoisIsraeliItalianJamaicanJapaneseJordanianKenyanKiowaKoreanLaotianLatvianLebaneseLiberianLithuanianLumbeeLuxembourgerMacedonianMalaysianMalteseMarshalleseMenomineeMexicanMexican American IndianMongolianMoroccanNative HawaiianNavajoNepaleseNew ZealanderNicaraguanNigerianNorthern EuropeanNorwegianOkinawanOsageOttawaPaiutePakistaniPalestinianPanamanianParaguayanPennsylvania GermanPeruvianPimaPolishPortuguesePotawatomiPuebloPuerto RicanPuget Sound SalishRomanianRussianSalvadoranSamoanScandinavianScotch-IrishScottishSeminoleSenegaleseSerbianShoshoneSierra LeoneanSiouxSlavicSlovakSloveneSomaliSouth AfricanSouth AmericanSouth American IndianSoviet UnionSpaniardSpanishSpanish AmericanSpanish American IndianSri LankanSubsaharan AfricanSudaneseSwedishSwissSyrianTaiwaneseThaiTlingit-HaidaTohono O'OdhamTonganTrinidadian and TobagonianTsimshianTurkishU.S. Virgin IslanderUgandanUkrainianUruguayanUteVenezuelanVietnameseWelshWest IndianYakamaYaquiYugoslavianYumanYup'ikZimbabwean
Immigrant Origin (Total)
AfghanistanAfricaAlbaniaArgentinaArmeniaAsiaAustraliaAustriaAzoresBahamasBangladeshBarbadosBelarusBelgiumBelizeBoliviaBosnia and HerzegovinaBrazilBulgariaBurma / MyanmarCabo VerdeCambodiaCameroonCanadaCaribbeanCentral AmericaChileChinaColombiaCongoCosta RicaCroatiaCubaCzechoslovakiaDenmarkDominicaDominican RepublicEastern AfricaEastern AsiaEastern EuropeEcuadorEgyptEl SalvadorEnglandEritreaEthiopiaEuropeFijiFranceGermanyGhanaGreeceGrenadaGuatemalaGuyanaHaitiHondurasHong KongHungaryIndiaIndonesiaIranIraqIrelandIsraelItalyJamaicaJapanJordanKazakhstanKenyaKoreaKuwaitLaosLatin AmericaLatviaLebanonLiberiaLithuaniaMalaysiaMexicoMicronesiaMiddle AfricaMoldovaMoroccoNepalNetherlandsNicaraguaNigeriaNorth MacedoniaNorthern AfricaNorthern EuropeNorwayOceaniaPakistanPanamaPeruPhilippinesPolandPortugalRomaniaRussiaSaudi ArabiaScotlandSenegalSerbiaSierra LeoneSingaporeSomaliaSouth AfricaSouth AmericaSouth Central AsiaSouth Eastern AsiaSouthern EuropeSpainSri LankaSt. Vincent and the GrenadinesSudanSwedenSwitzerlandSyriaTaiwanThailandTrinidad and TobagoTurkeyUgandaUkraineUruguayUzbekistanVenezuelaVietnamWest IndiesWestern AfricaWestern AsiaWestern EuropeYemenZaireZimbabwe
Immigrant Origin (Percentage)
AfghanistanAfricaAlbaniaArgentinaArmeniaAsiaAustraliaAustriaAzoresBahamasBangladeshBarbadosBelarusBelgiumBelizeBoliviaBosnia and HerzegovinaBrazilBulgariaBurma / MyanmarCabo VerdeCambodiaCameroonCanadaCaribbeanCentral AmericaChileChinaColombiaCongoCosta RicaCroatiaCubaCzechoslovakiaDenmarkDominicaDominican RepublicEastern AfricaEastern AsiaEastern EuropeEcuadorEgyptEl SalvadorEnglandEritreaEthiopiaEuropeFijiFranceGermanyGhanaGreeceGrenadaGuatemalaGuyanaHaitiHondurasHong KongHungaryIndiaIndonesiaIranIraqIrelandIsraelItalyJamaicaJapanJordanKazakhstanKenyaKoreaKuwaitLaosLatin AmericaLatviaLebanonLiberiaLithuaniaMalaysiaMexicoMicronesiaMiddle AfricaMoldovaMoroccoNepalNetherlandsNicaraguaNigeriaNorth MacedoniaNorthern AfricaNorthern EuropeNorwayOceaniaPakistanPanamaPeruPhilippinesPolandPortugalRomaniaRussiaSaudi ArabiaScotlandSenegalSerbiaSierra LeoneSingaporeSomaliaSouth AfricaSouth AmericaSouth Central AsiaSouth Eastern AsiaSouthern EuropeSpainSri LankaSt. Vincent and the GrenadinesSudanSwedenSwitzerlandSyriaTaiwanThailandTrinidad and TobagoTurkeyUgandaUkraineUruguayUzbekistanVenezuelaVietnamWest IndiesWestern AfricaWestern AsiaWestern EuropeYemenZaireZimbabwe
Income
Income (Families)
Income (Households)
Poverty
Poverty (Families)
Unemployment
Employment Occupations
Employment Industries
Employer Class
Commute Time
Commute Means
School Enrollment
Education by Degree Field
Occupancy
Finances
Physical Characteristics
Alaska
Compare Zip Codes
Comparison Subject

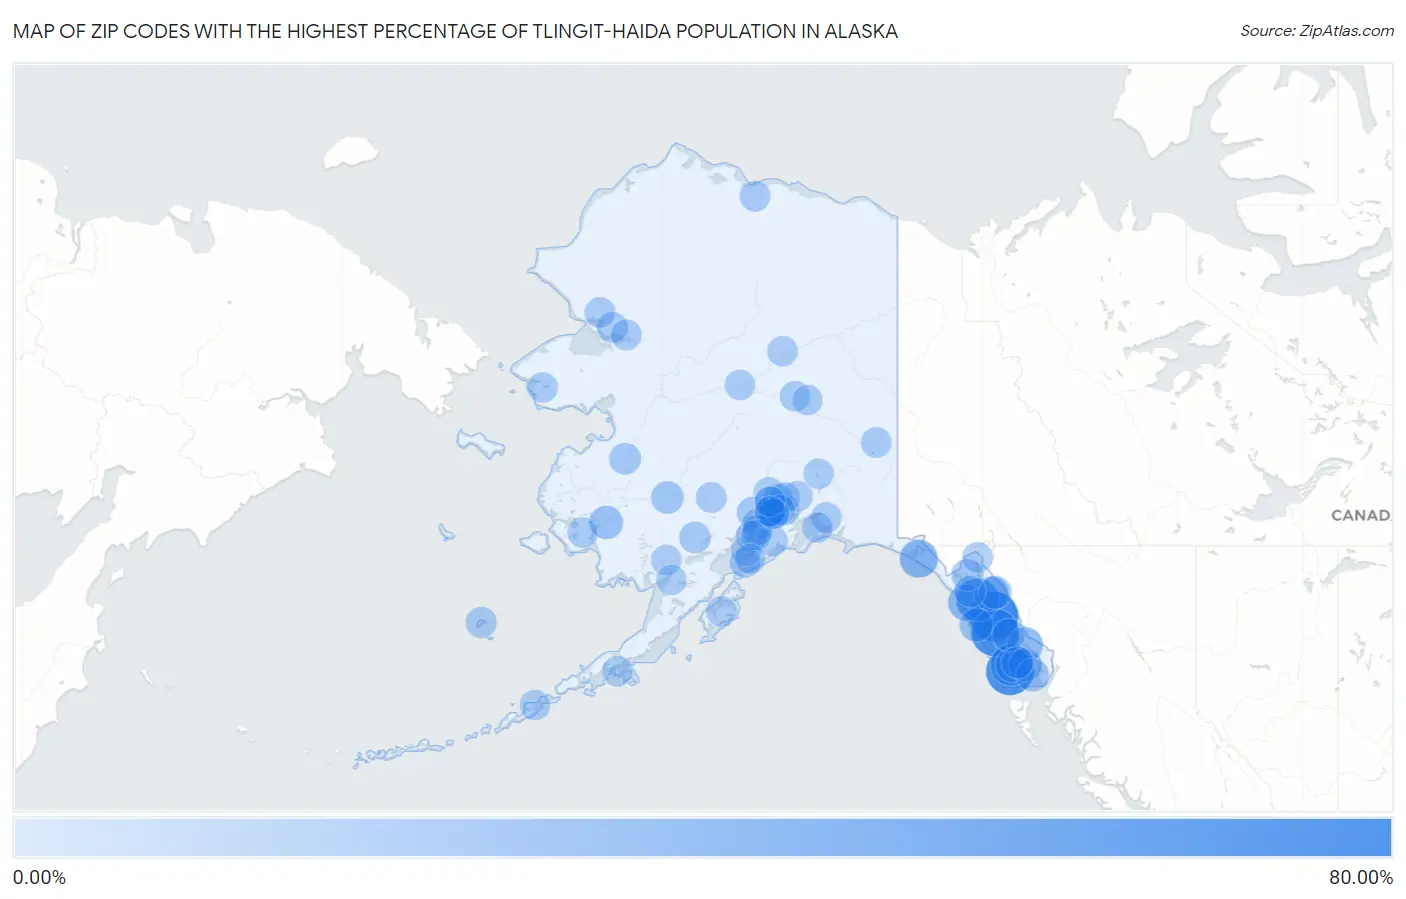
Map of Zip Codes with the Highest Percentage of Tlingit-Haida Population in Alaska

0.00%
80.00%
Zip Codes with the Highest Percentage of Tlingit-Haida Population in Alaska Map

Zip Codes with the Highest Percentage of Tlingit-Haida Population in Alaska

Zip Code Tlingit-Haida vs State vs National
1.9982076.85%1.70%(+75.1)#10.0082%(+76.8)#1
2.9992269.51%1.70%(+67.8)#20.0082%(+69.5)#2
3.9983069.34%1.70%(+67.6)#30.0082%(+69.3)#3
4.9982949.33%1.70%(+47.6)#40.0082%(+49.3)#4
5.9992544.78%1.70%(+43.1)#50.0082%(+44.8)#5
6.9968929.96%1.70%(+28.3)#60.0082%(+30.0)#6
7.9983223.53%1.70%(+21.8)#70.0082%(+23.5)#7
8.9992921.24%1.70%(+19.5)#80.0082%(+21.2)#8
9.9992115.92%1.70%(+14.2)#90.0082%(+15.9)#9
10.9982415.26%1.70%(+13.6)#100.0082%(+15.3)#10
11.9983512.27%1.70%(+10.6)#110.0082%(+12.3)#12
12.9962112.12%1.70%(+10.4)#120.0082%(+12.1)#13
13.9990111.18%1.70%(+9.48)#130.0082%(+11.2)#14
14.9980110.70%1.70%(+8.99)#140.0082%(+10.7)#15
15.9992610.03%1.70%(+8.33)#150.0082%(+10.0)#16
16.998338.92%1.70%(+7.22)#160.0082%(+8.91)#17
17.996688.22%1.70%(+6.52)#170.0082%(+8.21)#18
18.998276.94%1.70%(+5.24)#180.0082%(+6.93)#20
19.999196.91%1.70%(+5.21)#190.0082%(+6.91)#21
20.995905.24%1.70%(+3.54)#200.0082%(+5.23)#23
21.996404.41%1.70%(+2.71)#210.0082%(+4.40)#24
22.996824.01%1.70%(+2.31)#220.0082%(+4.01)#25
23.998263.94%1.70%(+2.24)#230.0082%(+3.94)#26
24.996602.87%1.70%(+1.16)#240.0082%(+2.86)#31
25.995672.30%1.70%(+0.600)#250.0082%(+2.29)#33
26.996101.90%1.70%(+0.197)#260.0082%(+1.89)#35
27.997631.83%1.70%(+0.132)#270.0082%(+1.83)#36
28.997701.62%1.70%(-0.087)#280.0082%(+1.61)#38
29.995031.24%1.70%(-0.467)#290.0082%(+1.23)#46
30.996111.19%1.70%(-0.518)#300.0082%(+1.18)#47
31.997801.16%1.70%(-0.539)#310.0082%(+1.16)#48
32.998401.07%1.70%(-0.628)#320.0082%(+1.07)#49
33.997891.06%1.70%(-0.639)#330.0082%(+1.06)#50
34.996631.00%1.70%(-0.705)#340.0082%(+0.989)#56
35.995150.92%1.70%(-0.778)#350.0082%(+0.916)#58
36.995010.91%1.70%(-0.794)#360.0082%(+0.901)#59
37.997520.89%1.70%(-0.812)#370.0082%(+0.883)#60
38.995040.89%1.70%(-0.814)#380.0082%(+0.881)#61
39.996860.86%1.70%(-0.843)#390.0082%(+0.852)#64
40.996640.86%1.70%(-0.845)#400.0082%(+0.850)#65
41.996880.72%1.70%(-0.984)#410.0082%(+0.711)#75
42.995080.67%1.70%(-1.03)#420.0082%(+0.663)#80
43.996360.66%1.70%(-1.04)#430.0082%(+0.655)#82
44.995020.62%1.70%(-1.08)#440.0082%(+0.616)#83
45.996150.53%1.70%(-1.17)#450.0082%(+0.523)#92
46.995160.51%1.70%(-1.19)#460.0082%(+0.501)#97
47.996610.48%1.70%(-1.23)#470.0082%(+0.469)#106
48.995560.47%1.70%(-1.23)#480.0082%(+0.463)#108
49.997770.47%1.70%(-1.24)#490.0082%(+0.459)#110
50.996230.43%1.70%(-1.27)#500.0082%(+0.424)#112
51.995740.42%1.70%(-1.28)#510.0082%(+0.412)#114
52.995180.39%1.70%(-1.32)#520.0082%(+0.378)#121
53.996740.37%1.70%(-1.33)#530.0082%(+0.364)#125
54.997010.37%1.70%(-1.33)#540.0082%(+0.363)#126
55.996540.34%1.70%(-1.36)#550.0082%(+0.336)#135
56.996450.33%1.70%(-1.37)#560.0082%(+0.326)#137
57.996720.32%1.70%(-1.39)#570.0082%(+0.309)#143
58.996690.32%1.70%(-1.39)#580.0082%(+0.308)#144
59.995770.30%1.70%(-1.40)#590.0082%(+0.290)#151
60.997090.29%1.70%(-1.41)#600.0082%(+0.285)#155
61.997050.28%1.70%(-1.42)#610.0082%(+0.276)#159
62.996330.24%1.70%(-1.46)#620.0082%(+0.231)#175
63.995070.24%1.70%(-1.47)#630.0082%(+0.227)#177
64.995880.17%1.70%(-1.53)#640.0082%(+0.163)#218
65.997620.14%1.70%(-1.56)#650.0082%(+0.136)#248
66.996520.12%1.70%(-1.58)#660.0082%(+0.116)#276
67.995590.11%1.70%(-1.60)#670.0082%(+0.099)#305
68.996030.098%1.70%(-1.60)#680.0082%(+0.090)#323
69.996850.084%1.70%(-1.62)#690.0082%(+0.076)#348
70.995170.037%1.70%(-1.67)#700.0082%(+0.028)#488

Common Questions

What are the Top 10 Zip Codes with the Highest Percentage of Tlingit-Haida Population in Alaska?
Top 10 Zip Codes with the Highest Percentage of Tlingit-Haida Population in Alaska are:
#1
76.85%
#2
69.51%
#3
69.34%
#4
49.33%
#5
44.78%
#6
29.96%
#7
23.53%
#8
21.24%
#9
15.92%
#10
15.26%
What zip code has the Highest Percentage of Tlingit-Haida Population in Alaska?
99820 has the Highest Percentage of Tlingit-Haida Population in Alaska with 76.85%.
What is the Percentage of Tlingit-Haida Population in the State of Alaska?
Percentage of Tlingit-Haida Population in Alaska is 1.70%.
What is the Percentage of Tlingit-Haida Population in the United States?
Percentage of Tlingit-Haida Population in the United States is 0.0082%.