Zip Codes with the Highest Percentage of Population Employed in Construction & Extraction in Alaska
RELATED REPORTS & OPTIONS
Construction & Extraction
Alaska
Compare Zip Codes
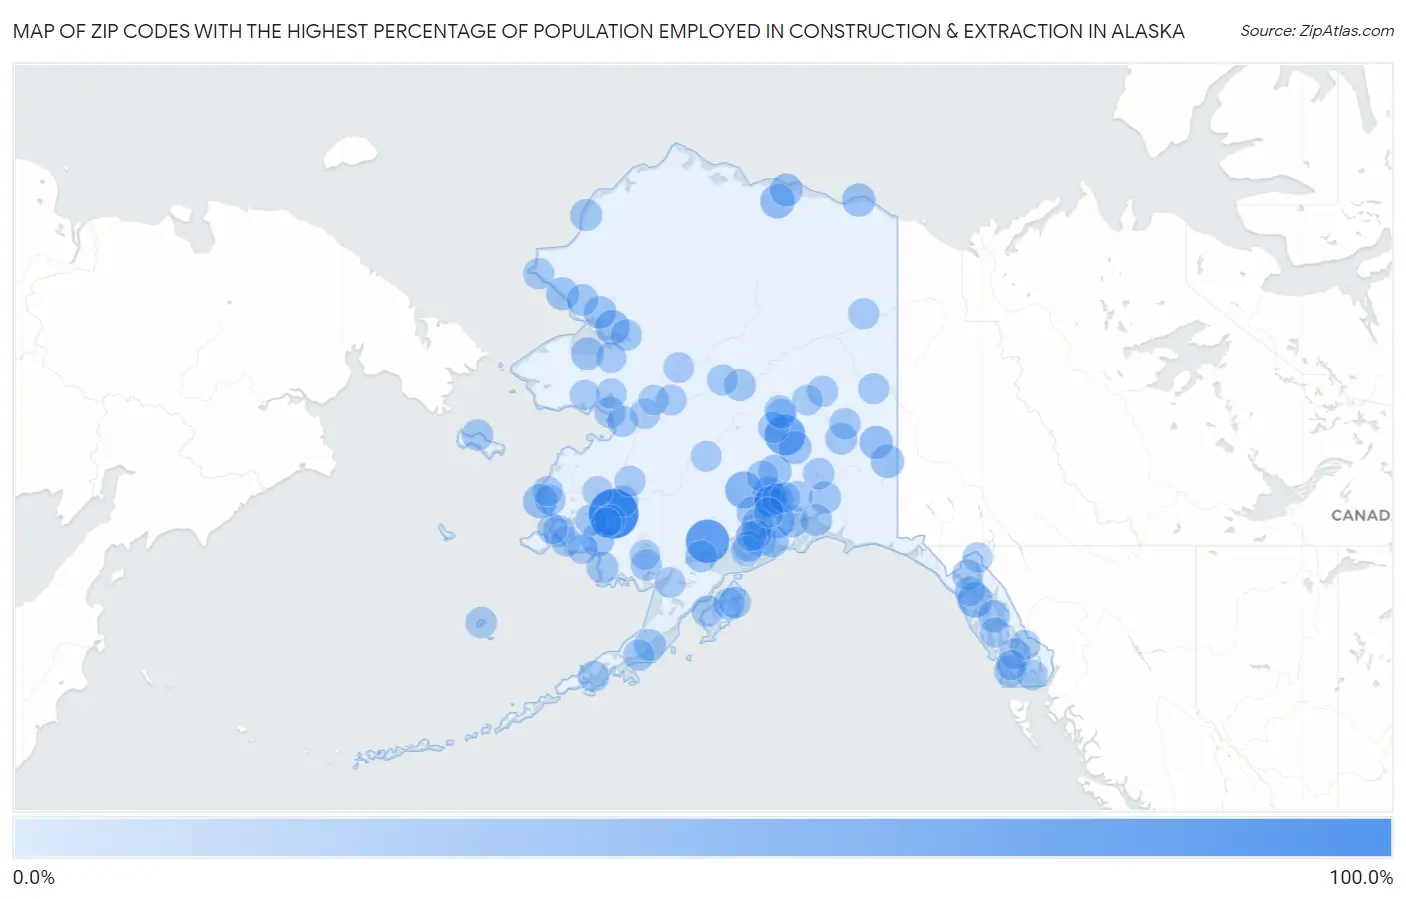
Map of Zip Codes with the Highest Percentage of Population Employed in Construction & Extraction in Alaska
0.0%
100.0%
Zip Codes with the Highest Percentage of Population Employed in Construction & Extraction in Alaska
| Zip Code | % Employed | vs State | vs National | |
| 1. | 99679 | 93.2% | 6.2%(+87.0)#1 | 5.0%(+88.2)#41 |
| 2. | 99653 | 64.4% | 6.2%(+58.2)#2 | 5.0%(+59.4)#66 |
| 3. | 99755 | 52.3% | 6.2%(+46.1)#3 | 5.0%(+47.3)#113 |
| 4. | 99667 | 36.4% | 6.2%(+30.2)#4 | 5.0%(+31.4)#269 |
| 5. | 99841 | 26.6% | 6.2%(+20.4)#5 | 5.0%(+21.6)#528 |
| 6. | 99763 | 25.4% | 6.2%(+19.2)#6 | 5.0%(+20.4)#569 |
| 7. | 99519 | 24.5% | 6.2%(+18.3)#7 | 5.0%(+19.5)#621 |
| 8. | 99605 | 22.6% | 6.2%(+16.4)#8 | 5.0%(+17.6)#748 |
| 9. | 99604 | 22.0% | 6.2%(+15.8)#9 | 5.0%(+17.0)#792 |
| 10. | 99764 | 19.6% | 6.2%(+13.4)#10 | 5.0%(+14.6)#1,047 |
| 11. | 99780 | 19.6% | 6.2%(+13.4)#11 | 5.0%(+14.6)#1,053 |
| 12. | 99747 | 18.9% | 6.2%(+12.7)#12 | 5.0%(+13.9)#1,145 |
| 13. | 99729 | 18.8% | 6.2%(+12.5)#13 | 5.0%(+13.8)#1,173 |
| 14. | 99676 | 18.6% | 6.2%(+12.4)#14 | 5.0%(+13.6)#1,189 |
| 15. | 99578 | 18.5% | 6.2%(+12.3)#15 | 5.0%(+13.5)#1,217 |
| 16. | 99568 | 18.0% | 6.2%(+11.8)#16 | 5.0%(+13.0)#1,300 |
| 17. | 99750 | 17.5% | 6.2%(+11.3)#17 | 5.0%(+12.5)#1,382 |
| 18. | 99734 | 17.5% | 6.2%(+11.3)#18 | 5.0%(+12.5)#1,386 |
| 19. | 99752 | 17.3% | 6.2%(+11.1)#19 | 5.0%(+12.3)#1,415 |
| 20. | 99736 | 17.0% | 6.2%(+10.8)#20 | 5.0%(+12.0)#1,473 |
| 21. | 99694 | 16.6% | 6.2%(+10.4)#21 | 5.0%(+11.6)#1,562 |
| 22. | 99688 | 15.3% | 6.2%(+9.11)#22 | 5.0%(+10.3)#1,902 |
| 23. | 99664 | 14.3% | 6.2%(+8.10)#23 | 5.0%(+9.31)#2,307 |
| 24. | 99820 | 14.2% | 6.2%(+7.98)#24 | 5.0%(+9.19)#2,372 |
| 25. | 99573 | 13.9% | 6.2%(+7.72)#25 | 5.0%(+8.93)#2,498 |
| 26. | 99623 | 13.8% | 6.2%(+7.62)#26 | 5.0%(+8.83)#2,539 |
| 27. | 99693 | 13.8% | 6.2%(+7.61)#27 | 5.0%(+8.82)#2,545 |
| 28. | 99677 | 13.3% | 6.2%(+7.13)#28 | 5.0%(+8.34)#2,786 |
| 29. | 99589 | 13.0% | 6.2%(+6.84)#29 | 5.0%(+8.05)#2,912 |
| 30. | 99777 | 12.9% | 6.2%(+6.70)#30 | 5.0%(+7.91)#2,992 |
| 31. | 99759 | 12.9% | 6.2%(+6.70)#31 | 5.0%(+7.91)#2,993 |
| 32. | 99606 | 12.6% | 6.2%(+6.43)#32 | 5.0%(+7.64)#3,166 |
| 33. | 99761 | 12.6% | 6.2%(+6.40)#33 | 5.0%(+7.60)#3,187 |
| 34. | 99682 | 12.5% | 6.2%(+6.30)#34 | 5.0%(+7.51)#3,259 |
| 35. | 99690 | 12.5% | 6.2%(+6.30)#35 | 5.0%(+7.51)#3,272 |
| 36. | 99608 | 12.5% | 6.2%(+6.30)#36 | 5.0%(+7.51)#3,274 |
| 37. | 99609 | 12.2% | 6.2%(+6.02)#37 | 5.0%(+7.23)#3,440 |
| 38. | 99737 | 12.2% | 6.2%(+5.97)#38 | 5.0%(+7.18)#3,470 |
| 39. | 99564 | 12.0% | 6.2%(+5.80)#39 | 5.0%(+7.01)#3,592 |
| 40. | 99550 | 11.9% | 6.2%(+5.66)#40 | 5.0%(+6.87)#3,676 |
| 41. | 99922 | 11.9% | 6.2%(+5.65)#41 | 5.0%(+6.86)#3,685 |
| 42. | 99644 | 11.8% | 6.2%(+5.56)#42 | 5.0%(+6.77)#3,748 |
| 43. | 99760 | 11.6% | 6.2%(+5.45)#43 | 5.0%(+6.65)#3,855 |
| 44. | 99611 | 11.5% | 6.2%(+5.34)#44 | 5.0%(+6.55)#3,931 |
| 45. | 99706 | 11.1% | 6.2%(+4.91)#45 | 5.0%(+6.12)#4,293 |
| 46. | 99770 | 11.0% | 6.2%(+4.79)#46 | 5.0%(+5.99)#4,374 |
| 47. | 99683 | 10.9% | 6.2%(+4.66)#47 | 5.0%(+5.86)#4,514 |
| 48. | 99769 | 10.8% | 6.2%(+4.57)#48 | 5.0%(+5.78)#4,583 |
| 49. | 99626 | 10.8% | 6.2%(+4.57)#49 | 5.0%(+5.78)#4,585 |
| 50. | 99588 | 10.5% | 6.2%(+4.33)#50 | 5.0%(+5.54)#4,818 |
| 51. | 99648 | 10.3% | 6.2%(+4.14)#51 | 5.0%(+5.35)#5,045 |
| 52. | 99743 | 10.3% | 6.2%(+4.09)#52 | 5.0%(+5.30)#5,085 |
| 53. | 99652 | 10.2% | 6.2%(+4.00)#53 | 5.0%(+5.21)#5,180 |
| 54. | 99654 | 10.1% | 6.2%(+3.86)#54 | 5.0%(+5.07)#5,331 |
| 55. | 99771 | 10.0% | 6.2%(+3.80)#55 | 5.0%(+5.01)#5,404 |
| 56. | 99766 | 9.8% | 6.2%(+3.59)#56 | 5.0%(+4.80)#5,661 |
| 57. | 99660 | 9.8% | 6.2%(+3.57)#57 | 5.0%(+4.78)#5,684 |
| 58. | 99827 | 9.7% | 6.2%(+3.52)#58 | 5.0%(+4.73)#5,733 |
| 59. | 99740 | 9.6% | 6.2%(+3.35)#59 | 5.0%(+4.56)#5,968 |
| 60. | 99555 | 9.4% | 6.2%(+3.17)#60 | 5.0%(+4.38)#6,209 |
| 61. | 99612 | 9.4% | 6.2%(+3.16)#61 | 5.0%(+4.37)#6,214 |
| 62. | 99712 | 9.3% | 6.2%(+3.09)#62 | 5.0%(+4.30)#6,321 |
| 63. | 99552 | 9.2% | 6.2%(+2.99)#63 | 5.0%(+4.20)#6,459 |
| 64. | 99684 | 9.1% | 6.2%(+2.87)#64 | 5.0%(+4.07)#6,668 |
| 65. | 99563 | 9.0% | 6.2%(+2.76)#65 | 5.0%(+3.97)#6,819 |
| 66. | 99768 | 8.9% | 6.2%(+2.66)#66 | 5.0%(+3.87)#6,981 |
| 67. | 99738 | 8.6% | 6.2%(+2.37)#67 | 5.0%(+3.58)#7,468 |
| 68. | 99602 | 8.3% | 6.2%(+2.13)#68 | 5.0%(+3.34)#7,879 |
| 69. | 99727 | 8.1% | 6.2%(+1.91)#69 | 5.0%(+3.11)#8,270 |
| 70. | 99627 | 8.0% | 6.2%(+1.85)#70 | 5.0%(+3.05)#8,405 |
| 71. | 99741 | 8.0% | 6.2%(+1.83)#71 | 5.0%(+3.04)#8,418 |
| 72. | 99674 | 7.9% | 6.2%(+1.69)#72 | 5.0%(+2.90)#8,701 |
| 73. | 99645 | 7.7% | 6.2%(+1.54)#73 | 5.0%(+2.75)#8,998 |
| 74. | 99639 | 7.7% | 6.2%(+1.47)#74 | 5.0%(+2.68)#9,161 |
| 75. | 99705 | 7.6% | 6.2%(+1.44)#75 | 5.0%(+2.64)#9,234 |
| 76. | 99918 | 7.5% | 6.2%(+1.30)#76 | 5.0%(+2.51)#9,542 |
| 77. | 99669 | 7.3% | 6.2%(+1.08)#77 | 5.0%(+2.28)#10,038 |
| 78. | 99748 | 7.2% | 6.2%(+1.01)#78 | 5.0%(+2.21)#10,220 |
| 79. | 99926 | 7.1% | 6.2%(+0.942)#79 | 5.0%(+2.15)#10,367 |
| 80. | 99753 | 7.1% | 6.2%(+0.942)#80 | 5.0%(+2.15)#10,377 |
| 81. | 99670 | 7.1% | 6.2%(+0.942)#81 | 5.0%(+2.15)#10,388 |
| 82. | 99556 | 7.0% | 6.2%(+0.797)#82 | 5.0%(+2.00)#10,746 |
| 83. | 99746 | 6.9% | 6.2%(+0.696)#83 | 5.0%(+1.90)#10,996 |
| 84. | 99561 | 6.8% | 6.2%(+0.637)#84 | 5.0%(+1.84)#11,143 |
| 85. | 99739 | 6.7% | 6.2%(+0.466)#85 | 5.0%(+1.67)#11,583 |
| 86. | 99585 | 6.7% | 6.2%(+0.466)#86 | 5.0%(+1.67)#11,584 |
| 87. | 99929 | 6.6% | 6.2%(+0.425)#87 | 5.0%(+1.63)#11,691 |
| 88. | 99662 | 6.6% | 6.2%(+0.411)#88 | 5.0%(+1.62)#11,735 |
| 89. | 99681 | 6.6% | 6.2%(+0.368)#89 | 5.0%(+1.58)#11,848 |
| 90. | 99925 | 6.4% | 6.2%(+0.229)#90 | 5.0%(+1.44)#12,246 |
| 91. | 99826 | 6.4% | 6.2%(+0.215)#91 | 5.0%(+1.42)#12,278 |
| 92. | 99744 | 6.4% | 6.2%(+0.182)#92 | 5.0%(+1.39)#12,363 |
| 93. | 99610 | 6.3% | 6.2%(+0.087)#93 | 5.0%(+1.29)#12,633 |
| 94. | 99840 | 6.2% | 6.2%(-0.023)#94 | 5.0%(+1.18)#12,977 |
| 95. | 99576 | 6.2% | 6.2%(-0.044)#95 | 5.0%(+1.16)#13,038 |
| 96. | 99765 | 6.1% | 6.2%(-0.140)#96 | 5.0%(+1.07)#13,315 |
| 97. | 99622 | 6.0% | 6.2%(-0.190)#97 | 5.0%(+1.02)#13,464 |
| 98. | 99830 | 6.0% | 6.2%(-0.223)#98 | 5.0%(+0.984)#13,570 |
| 99. | 99621 | 5.9% | 6.2%(-0.280)#99 | 5.0%(+0.927)#13,719 |
| 100. | 99502 | 5.9% | 6.2%(-0.313)#100 | 5.0%(+0.894)#13,801 |
Common Questions
What are the Top 10 Zip Codes with the Highest Percentage of Population Employed in Construction & Extraction in Alaska?
Top 10 Zip Codes with the Highest Percentage of Population Employed in Construction & Extraction in Alaska are:
What zip code has the Highest Percentage of Population Employed in Construction & Extraction in Alaska?
99679 has the Highest Percentage of Population Employed in Construction & Extraction in Alaska with 93.2%.
What is the Percentage of Population Employed in Construction & Extraction in the State of Alaska?
Percentage of Population Employed in Construction & Extraction in Alaska is 6.2%.
What is the Percentage of Population Employed in Construction & Extraction in the United States?
Percentage of Population Employed in Construction & Extraction in the United States is 5.0%.