Trinidadian and Tobagonian GED/Equivalency
COMPARE
Trinidadian and Tobagonian
Select to Compare
GED/Equivalency
Trinidadian and Tobagonian GED/Equivalency
83.0%
GED/EQUIVALENCY
0.2/ 100
METRIC RATING
267th/ 347
METRIC RANK
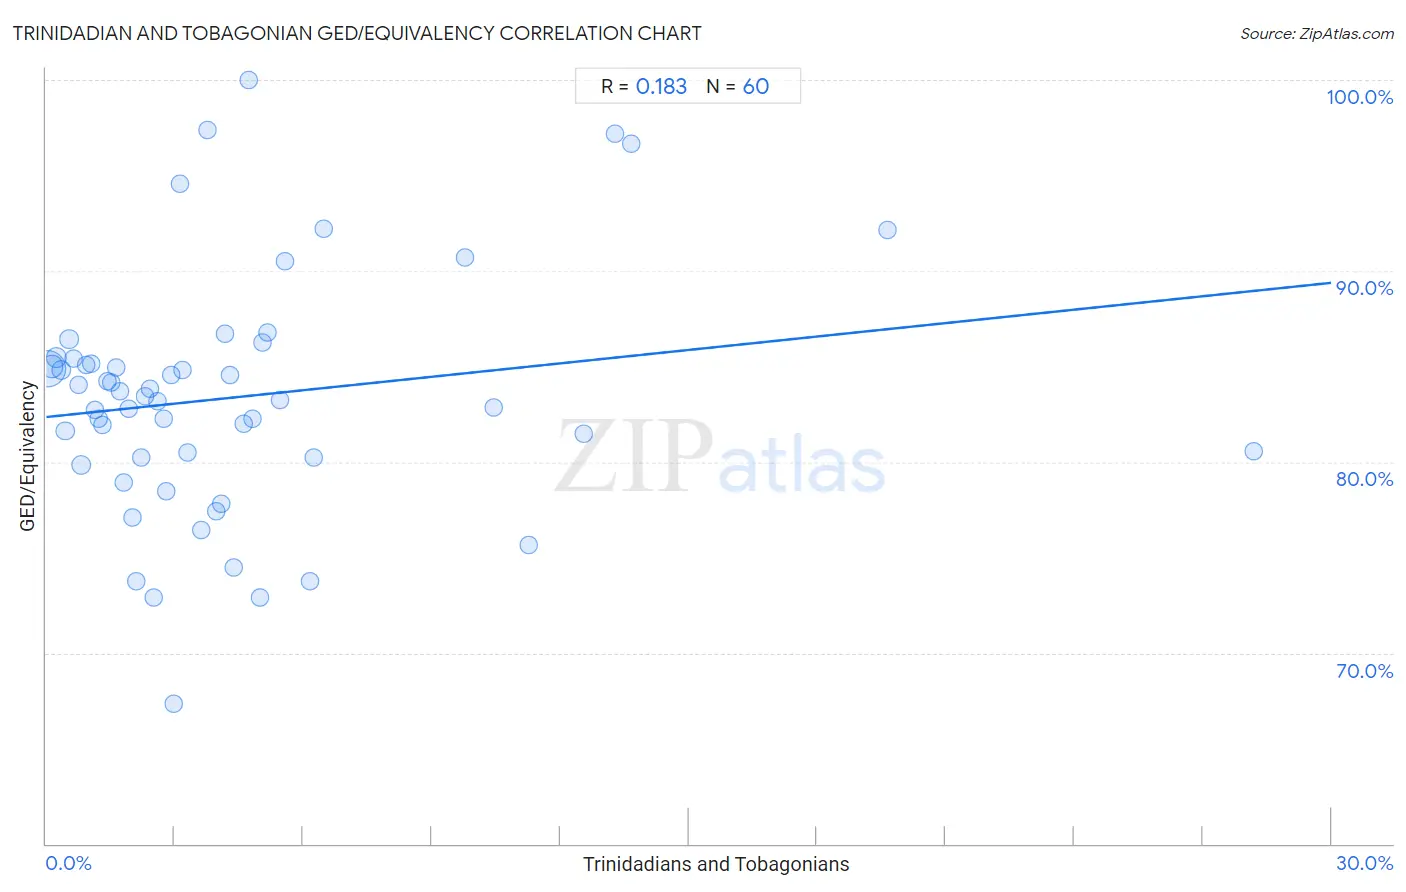
Trinidadian and Tobagonian GED/Equivalency Correlation Chart
The statistical analysis conducted on geographies consisting of 219,883,449 people shows a poor positive correlation between the proportion of Trinidadians and Tobagonians and percentage of population with at least ged/equivalency education in the United States with a correlation coefficient (R) of 0.183 and weighted average of 83.0%. On average, for every 1% (one percent) increase in Trinidadians and Tobagonians within a typical geography, there is an increase of 0.23% in percentage of population with at least ged/equivalency education.
It is essential to understand that the correlation between the percentage of Trinidadians and Tobagonians and percentage of population with at least ged/equivalency education does not imply a direct cause-and-effect relationship. It remains uncertain whether the presence of Trinidadians and Tobagonians influences an upward or downward trend in the level of percentage of population with at least ged/equivalency education within an area, or if Trinidadians and Tobagonians simply ended up residing in those areas with higher or lower levels of percentage of population with at least ged/equivalency education due to other factors.
Demographics Similar to Trinidadians and Tobagonians by GED/Equivalency
In terms of ged/equivalency, the demographic groups most similar to Trinidadians and Tobagonians are West Indian (83.1%, a difference of 0.020%), Kiowa (83.1%, a difference of 0.020%), Bangladeshi (83.1%, a difference of 0.030%), Immigrants from Congo (83.1%, a difference of 0.040%), and Immigrants from Burma/Myanmar (83.0%, a difference of 0.040%).
| Demographics | Rating | Rank | GED/Equivalency |
| Choctaw | 0.3 /100 | #260 | Tragic 83.1% |
| Inupiat | 0.2 /100 | #261 | Tragic 83.1% |
| Immigrants from Armenia | 0.2 /100 | #262 | Tragic 83.1% |
| Immigrants from Congo | 0.2 /100 | #263 | Tragic 83.1% |
| Bangladeshis | 0.2 /100 | #264 | Tragic 83.1% |
| West Indians | 0.2 /100 | #265 | Tragic 83.1% |
| Kiowa | 0.2 /100 | #266 | Tragic 83.1% |
| Trinidadians and Tobagonians | 0.2 /100 | #267 | Tragic 83.0% |
| Immigrants from Burma/Myanmar | 0.2 /100 | #268 | Tragic 83.0% |
| Hopi | 0.2 /100 | #269 | Tragic 83.0% |
| Immigrants from Jamaica | 0.2 /100 | #270 | Tragic 82.9% |
| U.S. Virgin Islanders | 0.2 /100 | #271 | Tragic 82.9% |
| Barbadians | 0.1 /100 | #272 | Tragic 82.9% |
| Pennsylvania Germans | 0.1 /100 | #273 | Tragic 82.9% |
| Immigrants from Trinidad and Tobago | 0.1 /100 | #274 | Tragic 82.8% |
Trinidadian and Tobagonian GED/Equivalency Correlation Summary
| Measurement | Trinidadian and Tobagonian Data | GED/Equivalency Data |
| Minimum | 0.036% | 67.3% |
| Maximum | 28.2% | 100.0% |
| Range | 28.2% | 32.7% |
| Mean | 4.4% | 83.4% |
| Median | 2.9% | 83.4% |
| Interquartile 25% (IQ1) | 1.5% | 80.2% |
| Interquartile 75% (IQ3) | 5.0% | 85.3% |
| Interquartile Range (IQR) | 3.5% | 5.0% |
| Standard Deviation (Sample) | 4.9% | 6.3% |
| Standard Deviation (Population) | 4.9% | 6.3% |
Correlation Details
| Trinidadian and Tobagonian Percentile | Sample Size | GED/Equivalency |
[ 0.0% - 0.5% ] 0.036% | 132,840,507 | 84.9% |
[ 0.0% - 0.5% ] 0.14% | 32,326,248 | 85.0% |
[ 0.0% - 0.5% ] 0.23% | 16,469,765 | 85.5% |
[ 0.0% - 0.5% ] 0.34% | 8,741,882 | 84.8% |
[ 0.0% - 0.5% ] 0.44% | 5,119,711 | 81.6% |
[ 0.5% - 1.0% ] 0.54% | 3,239,762 | 86.4% |
[ 0.5% - 1.0% ] 0.63% | 2,427,208 | 85.4% |
[ 0.5% - 1.0% ] 0.75% | 2,138,081 | 84.0% |
[ 0.5% - 1.0% ] 0.82% | 9,470,780 | 79.9% |
[ 0.5% - 1.0% ] 0.93% | 864,867 | 85.1% |
[ 1.0% - 1.5% ] 1.05% | 708,673 | 85.2% |
[ 1.0% - 1.5% ] 1.13% | 879,812 | 82.7% |
[ 1.0% - 1.5% ] 1.23% | 849,127 | 82.3% |
[ 1.0% - 1.5% ] 1.31% | 505,216 | 81.9% |
[ 1.0% - 1.5% ] 1.43% | 531,637 | 84.2% |
[ 1.5% - 2.0% ] 1.51% | 230,226 | 84.1% |
[ 1.5% - 2.0% ] 1.63% | 210,325 | 84.9% |
[ 1.5% - 2.0% ] 1.73% | 214,264 | 83.7% |
[ 1.5% - 2.0% ] 1.82% | 221,400 | 78.9% |
[ 1.5% - 2.0% ] 1.91% | 176,402 | 82.8% |
[ 2.0% - 2.5% ] 2.01% | 113,270 | 77.1% |
[ 2.0% - 2.5% ] 2.09% | 78,239 | 73.8% |
[ 2.0% - 2.5% ] 2.21% | 50,075 | 80.2% |
[ 2.0% - 2.5% ] 2.30% | 213,898 | 83.5% |
[ 2.0% - 2.5% ] 2.43% | 119,105 | 83.9% |
[ 2.5% - 3.0% ] 2.52% | 105,641 | 72.9% |
[ 2.5% - 3.0% ] 2.61% | 18,755 | 83.2% |
[ 2.5% - 3.0% ] 2.73% | 41,983 | 82.3% |
[ 2.5% - 3.0% ] 2.81% | 26,547 | 78.5% |
[ 2.5% - 3.0% ] 2.90% | 63,904 | 84.5% |
[ 2.5% - 3.0% ] 2.97% | 1,649 | 67.3% |
[ 3.0% - 3.5% ] 3.12% | 3,042 | 94.5% |
[ 3.0% - 3.5% ] 3.17% | 28,606 | 84.8% |
[ 3.0% - 3.5% ] 3.31% | 74,741 | 80.5% |
[ 3.5% - 4.0% ] 3.61% | 8,399 | 76.4% |
[ 3.5% - 4.0% ] 3.76% | 719 | 97.4% |
[ 3.5% - 4.0% ] 3.97% | 57,192 | 77.4% |
[ 4.0% - 4.5% ] 4.07% | 87,698 | 77.8% |
[ 4.0% - 4.5% ] 4.17% | 10,495 | 86.7% |
[ 4.0% - 4.5% ] 4.30% | 7,953 | 84.5% |
[ 4.0% - 4.5% ] 4.38% | 150,569 | 74.5% |
[ 4.5% - 5.0% ] 4.62% | 101,053 | 82.0% |
[ 4.5% - 5.0% ] 4.73% | 1,312 | 100.0% |
[ 4.5% - 5.0% ] 4.83% | 101,329 | 82.2% |
[ 4.5% - 5.0% ] 4.98% | 51,153 | 72.9% |
[ 5.0% - 5.5% ] 5.05% | 66,262 | 86.3% |
[ 5.0% - 5.5% ] 5.17% | 7,277 | 86.8% |
[ 5.0% - 5.5% ] 5.47% | 78,506 | 83.3% |
[ 5.5% - 6.0% ] 5.57% | 2,332 | 90.5% |
[ 6.0% - 6.5% ] 6.14% | 29,820 | 73.8% |
[ 6.0% - 6.5% ] 6.24% | 2,322 | 80.2% |
[ 6.0% - 6.5% ] 6.49% | 1,510 | 92.2% |
[ 9.5% - 10.0% ] 9.77% | 1,177 | 90.7% |
[ 10.0% - 10.5% ] 10.45% | 134 | 82.8% |
[ 11.0% - 11.5% ] 11.27% | 630 | 75.6% |
[ 12.5% - 13.0% ] 12.56% | 4,179 | 81.5% |
[ 13.0% - 13.5% ] 13.29% | 2,980 | 97.2% |
[ 13.5% - 14.0% ] 13.66% | 681 | 96.7% |
[ 19.5% - 20.0% ] 19.63% | 2,231 | 92.2% |
[ 28.0% - 28.5% ] 28.19% | 188 | 80.5% |