Spanish American Female Disability
COMPARE
Spanish American
Select to Compare
Female Disability
Spanish American Female Disability
14.0%
DISABILITY | FEMALES
0.0/ 100
METRIC RATING
316th/ 347
METRIC RANK
Spanish American Female Disability Correlation Chart
The statistical analysis conducted on geographies consisting of 103,163,564 people shows a significant positive correlation between the proportion of Spanish Americans and percentage of females with a disability in the United States with a correlation coefficient (R) of 0.617 and weighted average of 14.0%. On average, for every 1% (one percent) increase in Spanish Americans within a typical geography, there is an increase of 0.54% in percentage of females with a disability.
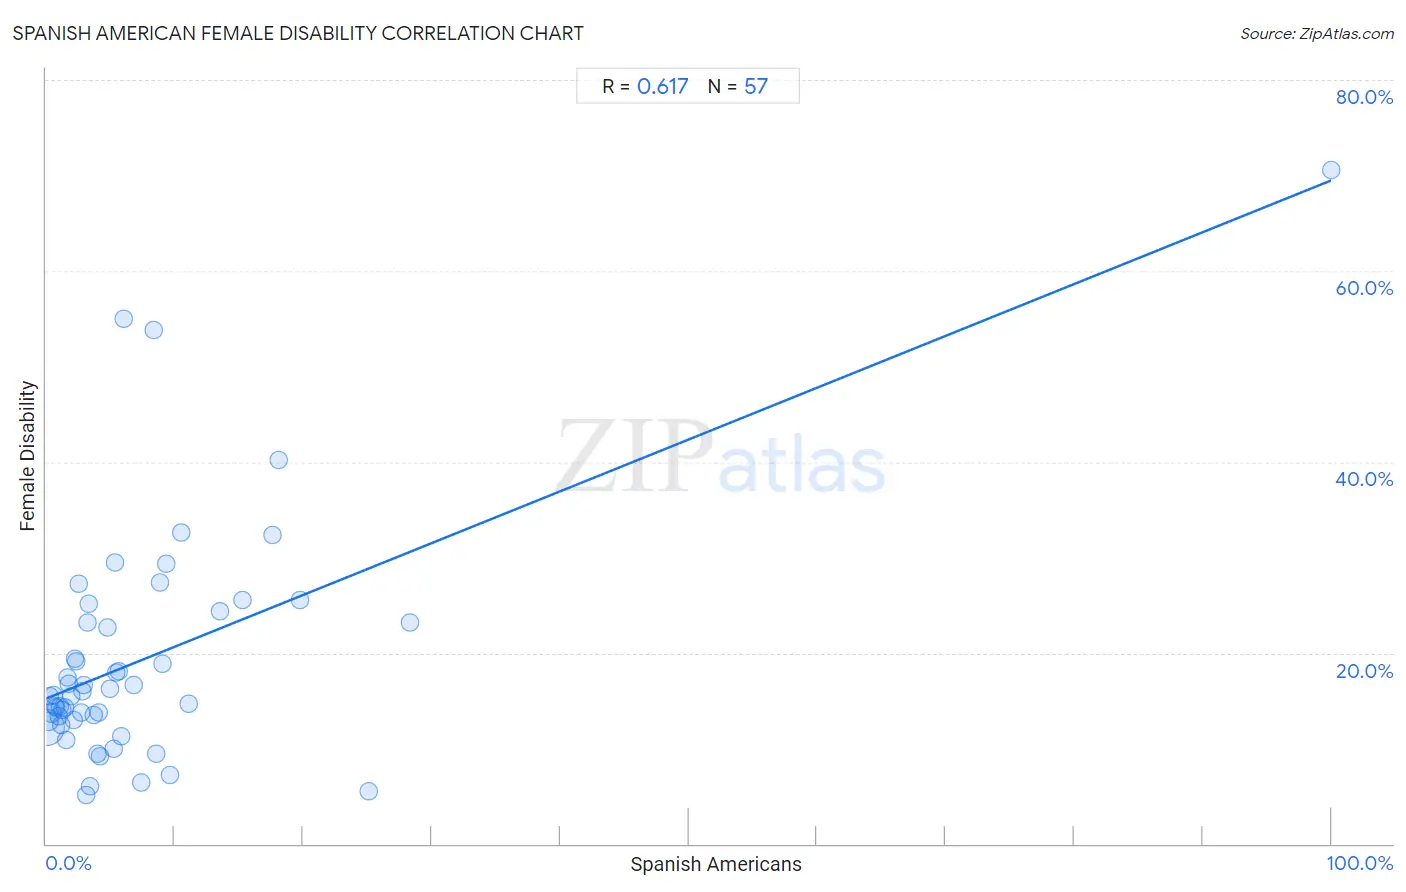
It is essential to understand that the correlation between the percentage of Spanish Americans and percentage of females with a disability does not imply a direct cause-and-effect relationship. It remains uncertain whether the presence of Spanish Americans influences an upward or downward trend in the level of percentage of females with a disability within an area, or if Spanish Americans simply ended up residing in those areas with higher or lower levels of percentage of females with a disability due to other factors.
Demographics Similar to Spanish Americans by Female Disability
In terms of female disability, the demographic groups most similar to Spanish Americans are Chippewa (14.0%, a difference of 0.11%), Paiute (14.0%, a difference of 0.22%), Alaskan Athabascan (13.9%, a difference of 0.36%), Iroquois (14.0%, a difference of 0.50%), and American (14.1%, a difference of 0.85%).
| Demographics | Rating | Rank | Female Disability |
| French American Indians | 0.0 /100 | #309 | Tragic 13.7% |
| Apache | 0.0 /100 | #310 | Tragic 13.7% |
| Hopi | 0.0 /100 | #311 | Tragic 13.7% |
| Delaware | 0.0 /100 | #312 | Tragic 13.8% |
| Blackfeet | 0.0 /100 | #313 | Tragic 13.8% |
| Puget Sound Salish | 0.0 /100 | #314 | Tragic 13.8% |
| Alaskan Athabascans | 0.0 /100 | #315 | Tragic 13.9% |
| Spanish Americans | 0.0 /100 | #316 | Tragic 14.0% |
| Chippewa | 0.0 /100 | #317 | Tragic 14.0% |
| Paiute | 0.0 /100 | #318 | Tragic 14.0% |
| Iroquois | 0.0 /100 | #319 | Tragic 14.0% |
| Americans | 0.0 /100 | #320 | Tragic 14.1% |
| Potawatomi | 0.0 /100 | #321 | Tragic 14.1% |
| Pueblo | 0.0 /100 | #322 | Tragic 14.1% |
| Blacks/African Americans | 0.0 /100 | #323 | Tragic 14.1% |
Spanish American Female Disability Correlation Summary
| Measurement | Spanish American Data | Female Disability Data |
| Minimum | 0.023% | 5.1% |
| Maximum | 100.0% | 70.6% |
| Range | 100.0% | 65.5% |
| Mean | 7.6% | 19.3% |
| Median | 4.0% | 15.6% |
| Interquartile 25% (IQ1) | 1.7% | 12.9% |
| Interquartile 75% (IQ3) | 8.7% | 23.8% |
| Interquartile Range (IQR) | 6.9% | 10.8% |
| Standard Deviation (Sample) | 13.9% | 12.2% |
| Standard Deviation (Population) | 13.8% | 12.1% |
Correlation Details
| Spanish American Percentile | Sample Size | Female Disability |
[ 0.0% - 0.5% ] 0.023% | 92,626,671 | 12.1% |
[ 0.0% - 0.5% ] 0.17% | 5,518,927 | 12.8% |
[ 0.0% - 0.5% ] 0.31% | 1,685,599 | 15.5% |
[ 0.0% - 0.5% ] 0.44% | 1,672,122 | 13.7% |
[ 0.5% - 1.0% ] 0.55% | 466,216 | 15.6% |
[ 0.5% - 1.0% ] 0.68% | 294,802 | 14.5% |
[ 0.5% - 1.0% ] 0.80% | 224,873 | 14.2% |
[ 0.5% - 1.0% ] 0.95% | 73,627 | 13.4% |
[ 1.0% - 1.5% ] 1.05% | 169,772 | 14.4% |
[ 1.0% - 1.5% ] 1.21% | 110,379 | 12.5% |
[ 1.0% - 1.5% ] 1.31% | 45,172 | 14.0% |
[ 1.0% - 1.5% ] 1.43% | 63,242 | 14.3% |
[ 1.5% - 2.0% ] 1.59% | 38,705 | 10.9% |
[ 1.5% - 2.0% ] 1.69% | 10,890 | 17.5% |
[ 1.5% - 2.0% ] 1.78% | 25,218 | 16.8% |
[ 1.5% - 2.0% ] 1.94% | 2,266 | 15.5% |
[ 2.0% - 2.5% ] 2.09% | 13,673 | 13.0% |
[ 2.0% - 2.5% ] 2.21% | 16,174 | 19.3% |
[ 2.0% - 2.5% ] 2.32% | 11,056 | 19.2% |
[ 2.5% - 3.0% ] 2.58% | 9,165 | 27.2% |
[ 2.5% - 3.0% ] 2.75% | 1,019 | 13.7% |
[ 2.5% - 3.0% ] 2.82% | 8,083 | 15.9% |
[ 2.5% - 3.0% ] 2.96% | 5,571 | 16.6% |
[ 3.0% - 3.5% ] 3.11% | 7,203 | 5.1% |
[ 3.0% - 3.5% ] 3.16% | 411 | 23.2% |
[ 3.0% - 3.5% ] 3.29% | 4,136 | 25.1% |
[ 3.0% - 3.5% ] 3.44% | 6,781 | 6.0% |
[ 3.5% - 4.0% ] 3.69% | 461 | 13.5% |
[ 3.5% - 4.0% ] 3.98% | 3,767 | 9.4% |
[ 4.0% - 4.5% ] 4.05% | 4,347 | 13.8% |
[ 4.0% - 4.5% ] 4.20% | 1,953 | 9.1% |
[ 4.5% - 5.0% ] 4.73% | 2,496 | 22.6% |
[ 4.5% - 5.0% ] 4.99% | 2,344 | 16.2% |
[ 5.0% - 5.5% ] 5.21% | 2,398 | 10.0% |
[ 5.0% - 5.5% ] 5.33% | 1,501 | 29.5% |
[ 5.0% - 5.5% ] 5.42% | 4,224 | 18.0% |
[ 5.5% - 6.0% ] 5.65% | 2,955 | 18.0% |
[ 5.5% - 6.0% ] 5.86% | 5,156 | 11.3% |
[ 6.0% - 6.5% ] 6.08% | 971 | 55.0% |
[ 6.5% - 7.0% ] 6.84% | 3,217 | 16.6% |
[ 7.0% - 7.5% ] 7.39% | 1,381 | 6.4% |
[ 8.0% - 8.5% ] 8.33% | 24 | 53.8% |
[ 8.5% - 9.0% ] 8.53% | 1,055 | 9.4% |
[ 8.5% - 9.0% ] 8.83% | 634 | 27.4% |
[ 9.0% - 9.5% ] 9.09% | 2,806 | 18.9% |
[ 9.0% - 9.5% ] 9.33% | 2,445 | 29.3% |
[ 9.5% - 10.0% ] 9.65% | 228 | 7.2% |
[ 10.0% - 10.5% ] 10.46% | 2,179 | 32.6% |
[ 11.0% - 11.5% ] 11.06% | 235 | 14.7% |
[ 13.5% - 14.0% ] 13.52% | 281 | 24.4% |
[ 15.0% - 15.5% ] 15.23% | 1,504 | 25.5% |
[ 17.5% - 18.0% ] 17.56% | 427 | 32.3% |
[ 18.0% - 18.5% ] 18.12% | 320 | 40.2% |
[ 19.5% - 20.0% ] 19.79% | 1,950 | 25.5% |
[ 25.0% - 25.5% ] 25.12% | 211 | 5.4% |
[ 28.0% - 28.5% ] 28.35% | 127 | 23.2% |
[ 99.5% - 100.0% ] 100.00% | 214 | 70.6% |