Paraguayan 1 or more Vehicles in Household
COMPARE
Paraguayan
Select to Compare
1 or more Vehicles in Household
Paraguayan 1 or more Vehicles in Household
85.7%
1+ VEHICLES AVAILABLE
0.0/ 100
METRIC RATING
297th/ 347
METRIC RANK
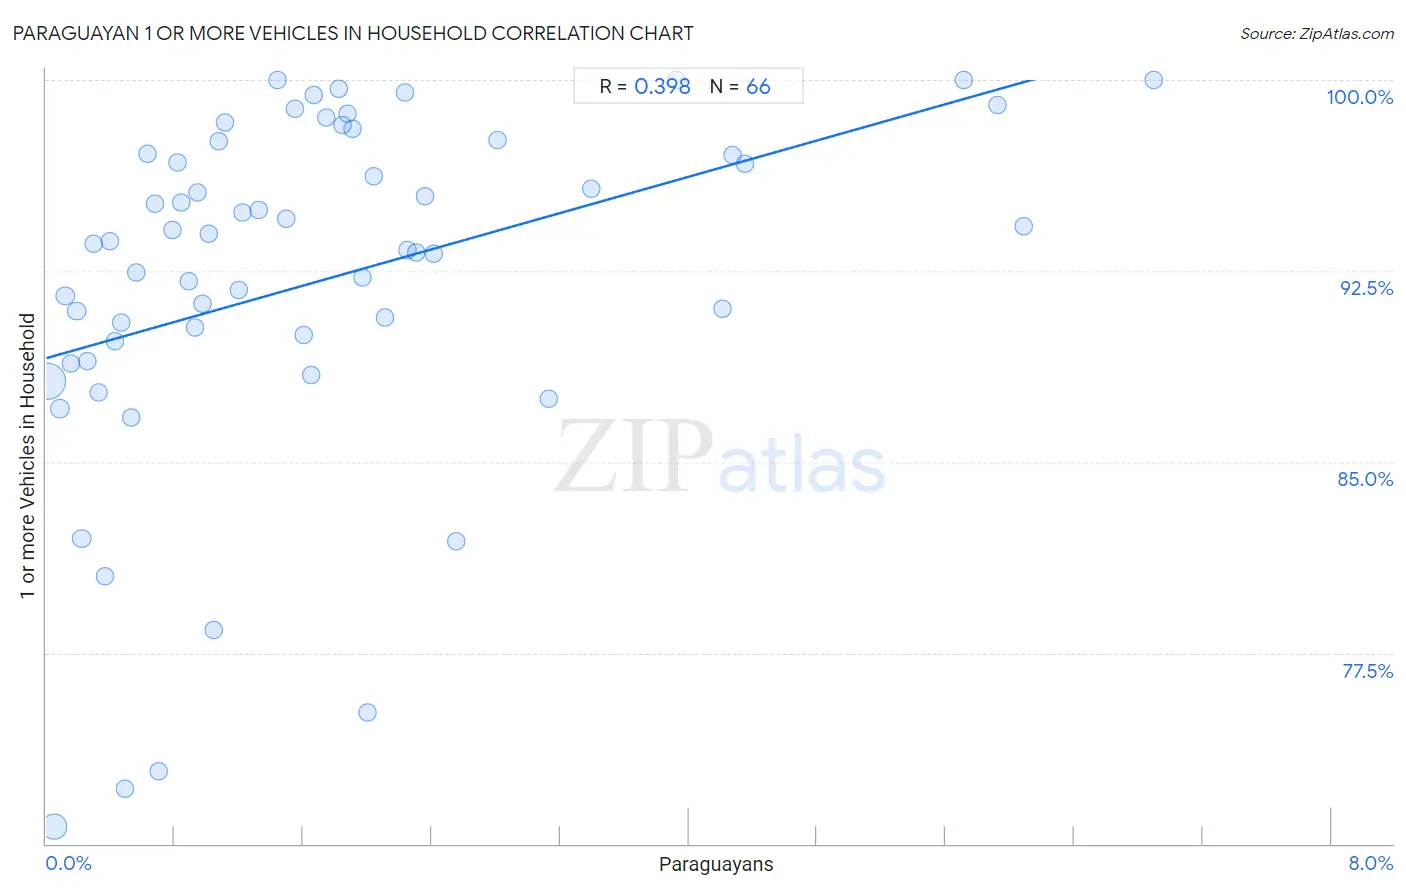
Paraguayan 1 or more Vehicles in Household Correlation Chart
The statistical analysis conducted on geographies consisting of 94,974,257 people shows a mild positive correlation between the proportion of Paraguayans and percentage of households with 1 or more vehicles available in the United States with a correlation coefficient (R) of 0.398 and weighted average of 85.7%. On average, for every 1% (one percent) increase in Paraguayans within a typical geography, there is an increase of 1.8% in percentage of households with 1 or more vehicles available.
It is essential to understand that the correlation between the percentage of Paraguayans and percentage of households with 1 or more vehicles available does not imply a direct cause-and-effect relationship. It remains uncertain whether the presence of Paraguayans influences an upward or downward trend in the level of percentage of households with 1 or more vehicles available within an area, or if Paraguayans simply ended up residing in those areas with higher or lower levels of percentage of households with 1 or more vehicles available due to other factors.
Demographics Similar to Paraguayans by 1 or more Vehicles in Household
In terms of 1 or more vehicles in household, the demographic groups most similar to Paraguayans are Belizean (85.7%, a difference of 0.080%), Immigrants from Spain (85.8%, a difference of 0.090%), Immigrants from Jamaica (85.8%, a difference of 0.12%), Alaskan Athabascan (86.0%, a difference of 0.29%), and Yuman (85.5%, a difference of 0.33%).
| Demographics | Rating | Rank | 1 or more Vehicles in Household |
| Immigrants from Australia | 0.0 /100 | #290 | Tragic 86.4% |
| Pima | 0.0 /100 | #291 | Tragic 86.3% |
| Okinawans | 0.0 /100 | #292 | Tragic 86.1% |
| Indians (Asian) | 0.0 /100 | #293 | Tragic 86.0% |
| Alaskan Athabascans | 0.0 /100 | #294 | Tragic 86.0% |
| Immigrants from Jamaica | 0.0 /100 | #295 | Tragic 85.8% |
| Immigrants from Spain | 0.0 /100 | #296 | Tragic 85.8% |
| Paraguayans | 0.0 /100 | #297 | Tragic 85.7% |
| Belizeans | 0.0 /100 | #298 | Tragic 85.7% |
| Yuman | 0.0 /100 | #299 | Tragic 85.5% |
| Immigrants from Russia | 0.0 /100 | #300 | Tragic 85.4% |
| Immigrants from Panama | 0.0 /100 | #301 | Tragic 85.4% |
| Moroccans | 0.0 /100 | #302 | Tragic 85.4% |
| Immigrants from Greece | 0.0 /100 | #303 | Tragic 85.4% |
| Immigrants from Ukraine | 0.0 /100 | #304 | Tragic 85.2% |
Paraguayan 1 or more Vehicles in Household Correlation Summary
| Measurement | Paraguayan Data | 1 or more Vehicles in Household Data |
| Minimum | 0.0097% | 70.7% |
| Maximum | 6.9% | 100.0% |
| Range | 6.9% | 29.3% |
| Mean | 1.7% | 92.1% |
| Median | 1.3% | 93.6% |
| Interquartile 25% (IQ1) | 0.56% | 89.7% |
| Interquartile 75% (IQ3) | 2.2% | 97.1% |
| Interquartile Range (IQR) | 1.7% | 7.4% |
| Standard Deviation (Sample) | 1.6% | 7.0% |
| Standard Deviation (Population) | 1.6% | 6.9% |
Correlation Details
| Paraguayan Percentile | Sample Size | 1 or more Vehicles in Household |
[ 0.0% - 0.5% ] 0.0097% | 59,466,563 | 88.2% |
[ 0.0% - 0.5% ] 0.048% | 21,216,207 | 70.7% |
[ 0.0% - 0.5% ] 0.086% | 4,499,602 | 87.1% |
[ 0.0% - 0.5% ] 0.12% | 2,172,198 | 91.5% |
[ 0.0% - 0.5% ] 0.16% | 1,491,002 | 88.9% |
[ 0.0% - 0.5% ] 0.19% | 1,311,719 | 90.9% |
[ 0.0% - 0.5% ] 0.22% | 1,048,184 | 82.0% |
[ 0.0% - 0.5% ] 0.26% | 898,186 | 88.9% |
[ 0.0% - 0.5% ] 0.30% | 352,963 | 93.6% |
[ 0.0% - 0.5% ] 0.33% | 495,571 | 87.7% |
[ 0.0% - 0.5% ] 0.37% | 113,195 | 80.5% |
[ 0.0% - 0.5% ] 0.39% | 417,057 | 93.7% |
[ 0.0% - 0.5% ] 0.43% | 231,985 | 89.7% |
[ 0.0% - 0.5% ] 0.47% | 98,814 | 90.5% |
[ 0.0% - 0.5% ] 0.49% | 194,850 | 72.2% |
[ 0.5% - 1.0% ] 0.53% | 49,954 | 86.8% |
[ 0.5% - 1.0% ] 0.56% | 43,661 | 92.4% |
[ 0.5% - 1.0% ] 0.63% | 39,165 | 97.1% |
[ 0.5% - 1.0% ] 0.67% | 142,413 | 95.2% |
[ 0.5% - 1.0% ] 0.70% | 51,402 | 72.8% |
[ 0.5% - 1.0% ] 0.79% | 23,838 | 94.1% |
[ 0.5% - 1.0% ] 0.81% | 34,779 | 96.8% |
[ 0.5% - 1.0% ] 0.84% | 32,958 | 95.2% |
[ 0.5% - 1.0% ] 0.89% | 32,940 | 92.1% |
[ 0.5% - 1.0% ] 0.93% | 52,168 | 90.3% |
[ 0.5% - 1.0% ] 0.94% | 74,018 | 95.6% |
[ 0.5% - 1.0% ] 0.97% | 42,808 | 91.2% |
[ 1.0% - 1.5% ] 1.01% | 20,482 | 94.0% |
[ 1.0% - 1.5% ] 1.05% | 52,580 | 78.4% |
[ 1.0% - 1.5% ] 1.08% | 7,154 | 97.6% |
[ 1.0% - 1.5% ] 1.11% | 24,656 | 98.3% |
[ 1.0% - 1.5% ] 1.20% | 25,130 | 91.7% |
[ 1.0% - 1.5% ] 1.22% | 1,639 | 94.8% |
[ 1.0% - 1.5% ] 1.32% | 32,720 | 94.9% |
[ 1.0% - 1.5% ] 1.44% | 4,929 | 100.0% |
[ 1.0% - 1.5% ] 1.50% | 7,822 | 94.5% |
[ 1.5% - 2.0% ] 1.55% | 11,518 | 98.8% |
[ 1.5% - 2.0% ] 1.61% | 5,725 | 90.0% |
[ 1.5% - 2.0% ] 1.65% | 5,632 | 88.4% |
[ 1.5% - 2.0% ] 1.67% | 1,739 | 99.4% |
[ 1.5% - 2.0% ] 1.74% | 1,378 | 98.5% |
[ 1.5% - 2.0% ] 1.82% | 3,399 | 99.7% |
[ 1.5% - 2.0% ] 1.85% | 9,581 | 98.3% |
[ 1.5% - 2.0% ] 1.87% | 800 | 98.7% |
[ 1.5% - 2.0% ] 1.91% | 23,734 | 98.1% |
[ 1.5% - 2.0% ] 1.97% | 712 | 92.2% |
[ 2.0% - 2.5% ] 2.00% | 500 | 75.2% |
[ 2.0% - 2.5% ] 2.04% | 28,413 | 96.2% |
[ 2.0% - 2.5% ] 2.11% | 1,516 | 90.7% |
[ 2.0% - 2.5% ] 2.23% | 7,573 | 99.5% |
[ 2.0% - 2.5% ] 2.25% | 5,110 | 93.3% |
[ 2.0% - 2.5% ] 2.30% | 5,000 | 93.2% |
[ 2.0% - 2.5% ] 2.36% | 12,581 | 95.5% |
[ 2.0% - 2.5% ] 2.41% | 664 | 93.2% |
[ 2.5% - 3.0% ] 2.55% | 392 | 81.9% |
[ 2.5% - 3.0% ] 2.81% | 5,867 | 97.6% |
[ 3.0% - 3.5% ] 3.12% | 160 | 87.5% |
[ 3.0% - 3.5% ] 3.39% | 1,385 | 95.7% |
[ 3.5% - 4.0% ] 3.92% | 689 | 100.0% |
[ 4.0% - 4.5% ] 4.21% | 285 | 91.0% |
[ 4.0% - 4.5% ] 4.27% | 7,888 | 97.1% |
[ 4.0% - 4.5% ] 4.35% | 8,822 | 96.7% |
[ 5.5% - 6.0% ] 5.71% | 175 | 100.0% |
[ 5.5% - 6.0% ] 5.92% | 1,047 | 99.0% |
[ 6.0% - 6.5% ] 6.08% | 16,602 | 94.3% |
[ 6.5% - 7.0% ] 6.90% | 58 | 100.0% |