Immigrants from Yemen Self-Care Disability

COMPARE

Immigrants from Yemen
Race
Ancestry
AfghanAfricanAlaska NativeAlaskan AthabascanAlbanianAleutAlsatianAmericanApacheArabArapahoArgentineanArmenianAssyrian/Chaldean/SyriacAustralianAustrianBahamianBangladeshiBarbadianBasqueBelgianBelizeanBermudanBhutaneseBlackfeetBolivianBrazilianBritishBritish West IndianBulgarianBurmeseCajunCambodianCanadianCape VerdeanCarpatho RusynCelticCentral AmericanCentral American IndianCherokeeCheyenneChickasawChileanChineseChippewaChoctawColombianColvilleComancheCosta RicanCreeCreekCroatianCrowCubanCypriotCzechCzechoslovakianDanishDelawareDominicanDutchDutch West IndianEastern EuropeanEcuadorianEgyptianEnglishEstonianEthiopianEuropeanFijianFilipinoFinnishFrenchFrench American IndianFrench CanadianGermanGerman RussianGhanaianGreekGuamanian/ChamorroGuatemalanGuyaneseHaitianHmongHonduranHopiHoumaHungarianIcelanderIndian (Asian)IndonesianInupiatIranianIraqiIrishIroquoisIsraeliItalianJamaicanJapaneseJordanianKenyanKiowaKoreanLaotianLatvianLebaneseLiberianLithuanianLumbeeLuxembourgerMacedonianMalaysianMalteseMarshalleseMenomineeMexicanMexican American IndianMongolianMoroccanNative HawaiianNavajoNepaleseNew ZealanderNicaraguanNigerianNorthern EuropeanNorwegianOkinawanOsageOttawaPaiutePakistaniPalestinianPanamanianParaguayanPennsylvania GermanPeruvianPimaPolishPortuguesePotawatomiPuebloPuerto RicanPuget Sound SalishRomanianRussianSalvadoranSamoanScandinavianScotch-IrishScottishSeminoleSenegaleseSerbianShoshoneSierra LeoneanSiouxSlavicSlovakSloveneSomaliSouth AfricanSouth AmericanSouth American IndianSoviet UnionSpaniardSpanishSpanish AmericanSpanish American IndianSri LankanSubsaharan AfricanSudaneseSwedishSwissSyrianTaiwaneseThaiTlingit-HaidaTohono O'OdhamTonganTrinidadian and TobagonianTsimshianTurkishU.S. Virgin IslanderUgandanUkrainianUruguayanUteVenezuelanVietnameseWelshWest IndianYakamaYaquiYugoslavianYumanYup'ikZimbabwean
Immigration
NonimmigrantsImmigrantsAfghanistanAfricaAlbaniaArgentinaArmeniaAsiaAustraliaAustriaBahamasBangladeshBarbadosBelarusBelgiumBelizeBoliviaBosnia and HerzegovinaBrazilBulgariaBurma/MyanmarCabo VerdeCambodiaCameroonCanadaCaribbeanCentral AmericaChileChinaColombiaCongoCosta RicaCroatiaCubaCzechoslovakiaDenmarkDominicaDominican RepublicEastern AfricaEastern AsiaEastern EuropeEcuadorEgyptEl SalvadorEnglandEritreaEthiopiaEuropeFijiFranceGermanyGhanaGreeceGrenadaGuatemalaGuyanaHaitiHondurasHong KongHungaryIndiaIndonesiaIranIraqIrelandIsraelItalyJamaicaJapanJordanKazakhstanKenyaKoreaKuwaitLaosLatin AmericaLatviaLebanonLiberiaLithuaniaMalaysiaMexicoMicronesiaMiddle AfricaMoldovaMoroccoNepalNetherlandsNicaraguaNigeriaNorth AmericaNorth MacedoniaNorthern AfricaNorthern EuropeNorwayOceaniaPakistanPanamaPeruPhilippinesPolandPortugalRomaniaRussiaSaudi ArabiaScotlandSenegalSerbiaSierra LeoneSingaporeSomaliaSouth AfricaSouth AmericaSouth Central AsiaSouth Eastern AsiaSouthern EuropeSpainSri LankaSt. Vincent and the GrenadinesSudanSwedenSwitzerlandSyriaTaiwanThailandTrinidad and TobagoTurkeyUgandaUkraineUruguayUzbekistanVenezuelaVietnamWest IndiesWestern AfricaWestern AsiaWestern EuropeYemenZaireZimbabweAzores
Select to Compare
Race
Ancestry
AfghanAfricanAlaska NativeAlaskan AthabascanAlbanianAleutAlsatianAmericanApacheArabArapahoArgentineanArmenianAssyrian/Chaldean/SyriacAustralianAustrianBahamianBangladeshiBarbadianBasqueBelgianBelizeanBermudanBhutaneseBlackfeetBolivianBrazilianBritishBritish West IndianBulgarianBurmeseCajunCambodianCanadianCape VerdeanCarpatho RusynCelticCentral AmericanCentral American IndianCherokeeCheyenneChickasawChileanChineseChippewaChoctawColombianColvilleComancheCosta RicanCreeCreekCroatianCrowCubanCypriotCzechCzechoslovakianDanishDelawareDominicanDutchDutch West IndianEastern EuropeanEcuadorianEgyptianEnglishEstonianEthiopianEuropeanFijianFilipinoFinnishFrenchFrench American IndianFrench CanadianGermanGerman RussianGhanaianGreekGuamanian/ChamorroGuatemalanGuyaneseHaitianHmongHonduranHopiHoumaHungarianIcelanderIndian (Asian)IndonesianInupiatIranianIraqiIrishIroquoisIsraeliItalianJamaicanJapaneseJordanianKenyanKiowaKoreanLaotianLatvianLebaneseLiberianLithuanianLumbeeLuxembourgerMacedonianMalaysianMalteseMarshalleseMenomineeMexicanMexican American IndianMongolianMoroccanNative HawaiianNavajoNepaleseNew ZealanderNicaraguanNigerianNorthern EuropeanNorwegianOkinawanOsageOttawaPaiutePakistaniPalestinianPanamanianParaguayanPennsylvania GermanPeruvianPimaPolishPortuguesePotawatomiPuebloPuerto RicanPuget Sound SalishRomanianRussianSalvadoranSamoanScandinavianScotch-IrishScottishSeminoleSenegaleseSerbianShoshoneSierra LeoneanSiouxSlavicSlovakSloveneSomaliSouth AfricanSouth AmericanSouth American IndianSoviet UnionSpaniardSpanishSpanish AmericanSpanish American IndianSri LankanSubsaharan AfricanSudaneseSwedishSwissSyrianTaiwaneseThaiTlingit-HaidaTohono O'OdhamTonganTrinidadian and TobagonianTsimshianTurkishU.S. Virgin IslanderUgandanUkrainianUruguayanUteVenezuelanVietnameseWelshWest IndianYakamaYaquiYugoslavianYumanYup'ikZimbabwean
Immigration
NonimmigrantsImmigrantsAfghanistanAfricaAlbaniaArgentinaArmeniaAsiaAustraliaAustriaBahamasBangladeshBarbadosBelarusBelgiumBelizeBoliviaBosnia and HerzegovinaBrazilBulgariaBurma/MyanmarCabo VerdeCambodiaCameroonCanadaCaribbeanCentral AmericaChileChinaColombiaCongoCosta RicaCroatiaCubaCzechoslovakiaDenmarkDominicaDominican RepublicEastern AfricaEastern AsiaEastern EuropeEcuadorEgyptEl SalvadorEnglandEritreaEthiopiaEuropeFijiFranceGermanyGhanaGreeceGrenadaGuatemalaGuyanaHaitiHondurasHong KongHungaryIndiaIndonesiaIranIraqIrelandIsraelItalyJamaicaJapanJordanKazakhstanKenyaKoreaKuwaitLaosLatin AmericaLatviaLebanonLiberiaLithuaniaMalaysiaMexicoMicronesiaMiddle AfricaMoldovaMoroccoNepalNetherlandsNicaraguaNigeriaNorth AmericaNorth MacedoniaNorthern AfricaNorthern EuropeNorwayOceaniaPakistanPanamaPeruPhilippinesPolandPortugalRomaniaRussiaSaudi ArabiaScotlandSenegalSerbiaSierra LeoneSingaporeSomaliaSouth AfricaSouth AmericaSouth Central AsiaSouth Eastern AsiaSouthern EuropeSpainSri LankaSt. Vincent and the GrenadinesSudanSwedenSwitzerlandSyriaTaiwanThailandTrinidad and TobagoTurkeyUgandaUkraineUruguayUzbekistanVenezuelaVietnamWest IndiesWestern AfricaWestern AsiaWestern EuropeZaireZimbabweAzores
Self-Care Disability
Income
Poverty
Unemployment
Labor Participation
Family Structure
Vehicle Availability
Education Level
Disability

Immigrants from Yemen Self-Care Disability
Tragic

3.0%
SELF-CARE DISABILITY
0.0/ 100
METRIC RATING
336th/ 347
METRIC RANK

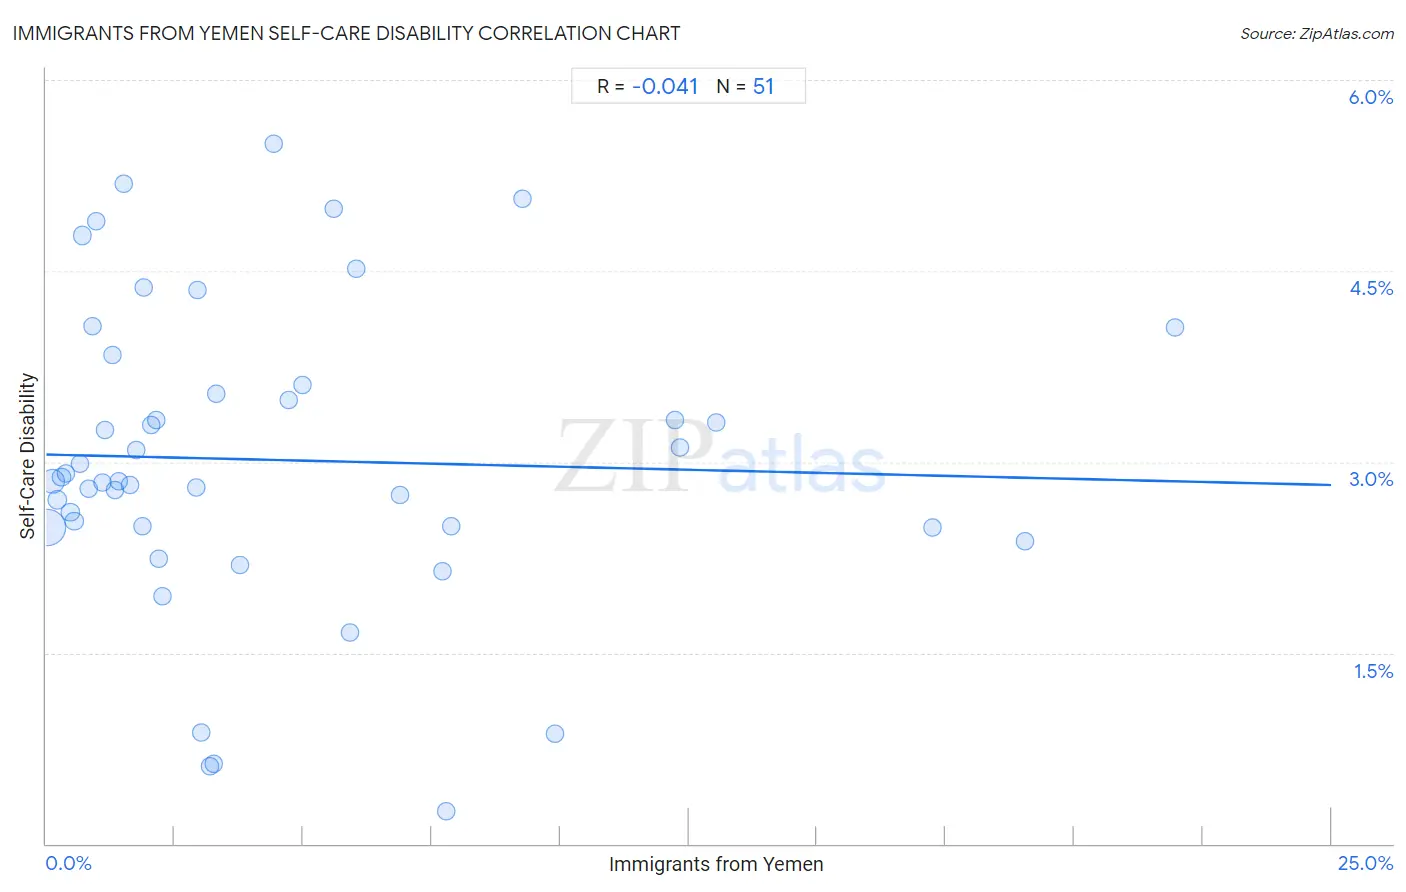
Immigrants from Yemen Self-Care Disability Correlation Chart

The statistical analysis conducted on geographies consisting of 82,420,060 people shows no correlation between the proportion of Immigrants from Yemen and percentage of population with self-care disability in the United States with a correlation coefficient (R) of -0.041 and weighted average of 3.0%. On average, for every 1% (one percent) increase in Immigrants from Yemen within a typical geography, there is a decrease of 0.0096% in percentage of population with self-care disability.
Immigrants from Yemen Self-Care Disability
It is essential to understand that the correlation between the percentage of Immigrants from Yemen and percentage of population with self-care disability does not imply a direct cause-and-effect relationship. It remains uncertain whether the presence of Immigrants from Yemen influences an upward or downward trend in the level of percentage of population with self-care disability within an area, or if Immigrants from Yemen simply ended up residing in those areas with higher or lower levels of percentage of population with self-care disability due to other factors.

Demographics Similar to Immigrants from Yemen by Self-Care Disability

In terms of self-care disability, the demographic groups most similar to Immigrants from Yemen are Immigrants from the Azores (3.0%, a difference of 0.16%), Houma (3.0%, a difference of 0.21%), Dutch West Indian (3.0%, a difference of 0.28%), Kiowa (3.0%, a difference of 0.51%), and Lumbee (3.0%, a difference of 0.87%).
DemographicsRating | RankSelf-Care Disability
Cajuns
0.0
/100
|
#329
Tragic
2.9%
Nepalese
0.0
/100
|
#330
Tragic
3.0%
Lumbee
0.0
/100
|
#331
Tragic
3.0%
Kiowa
0.0
/100
|
#332
Tragic
3.0%
Dutch West Indians
0.0
/100
|
#333
Tragic
3.0%
Houma
0.0
/100
|
#334
Tragic
3.0%
Immigrants from the Azores
0.0
/100
|
#335
Tragic
3.0%
Immigrants from Yemen
0.0
/100
|
#336
Tragic
3.0%
Choctaw
0.0
/100
|
#337
Tragic
3.0%
Cape Verdeans
0.0
/100
|
#338
Tragic
3.0%
Immigrants from Dominican Republic
0.0
/100
|
#339
Tragic
3.0%
Immigrants from Cabo Verde
0.0
/100
|
#340
Tragic
3.1%
Dominicans
0.0
/100
|
#341
Tragic
3.1%
Colville
0.0
/100
|
#342
Tragic
3.1%
Tohono O'odham
0.0
/100
|
#343
Tragic
3.1%

Immigrants from Yemen Self-Care Disability Correlation Summary

MeasurementImmigrants from Yemen DataSelf-Care Disability Data
Minimum0.021%0.26%
Maximum22.0%5.5%
Range21.9%5.2%
Mean4.5%3.0%
Median2.3%2.8%
Interquartile 25% (IQ1)1.1%2.5%
Interquartile 75% (IQ3)6.0%3.6%
Interquartile Range (IQR)4.9%1.1%
Standard Deviation (Sample)5.1%1.2%
Standard Deviation (Population)5.0%1.2%

Correlation Details

Immigrants from Yemen PercentileSample SizeSelf-Care Disability
[
0.0%
-
0.5%
]
0.021%
52,178,5842.5%
[
0.0%
-
0.5%
]
0.12%
17,218,0522.8%
[
0.0%
-
0.5%
]
0.21%
4,583,1742.7%
[
0.0%
-
0.5%
]
0.29%
2,107,4072.9%
[
0.0%
-
0.5%
]
0.38%
1,744,6762.9%
[
0.0%
-
0.5%
]
0.46%
1,571,8582.6%
[
0.5%
-
1.0%
]
0.55%
507,7122.5%
[
0.5%
-
1.0%
]
0.66%
280,3643.0%
[
0.5%
-
1.0%
]
0.70%
890,4984.8%
[
0.5%
-
1.0%
]
0.82%
222,3942.8%
[
0.5%
-
1.0%
]
0.89%
77,8094.1%
[
0.5%
-
1.0%
]
0.97%
127,7874.9%
[
1.0%
-
1.5%
]
1.09%
48,4212.8%
[
1.0%
-
1.5%
]
1.13%
66,8813.3%
[
1.0%
-
1.5%
]
1.28%
7023.8%
[
1.0%
-
1.5%
]
1.33%
17,9922.8%
[
1.0%
-
1.5%
]
1.42%
78,7502.8%
[
1.0%
-
1.5%
]
1.50%
83,6525.2%
[
1.5%
-
2.0%
]
1.62%
8,7652.8%
[
1.5%
-
2.0%
]
1.76%
20,5033.1%
[
1.5%
-
2.0%
]
1.88%
78,9322.5%
[
1.5%
-
2.0%
]
1.90%
12,7714.4%
[
2.0%
-
2.5%
]
2.03%
23,5653.3%
[
2.0%
-
2.5%
]
2.14%
16,8963.3%
[
2.0%
-
2.5%
]
2.20%
42,5482.2%
[
2.0%
-
2.5%
]
2.26%
1,5961.9%
[
2.5%
-
3.0%
]
2.93%
4,7162.8%
[
2.5%
-
3.0%
]
2.93%
8,2844.4%
[
3.0%
-
3.5%
]
3.02%
3970.87%
[
3.0%
-
3.5%
]
3.18%
1,8890.61%
[
3.0%
-
3.5%
]
3.27%
1,8370.63%
[
3.0%
-
3.5%
]
3.31%
2,6303.5%
[
3.5%
-
4.0%
]
3.77%
24,9902.2%
[
4.0%
-
4.5%
]
4.42%
2,4875.5%
[
4.5%
-
5.0%
]
4.71%
20,9363.5%
[
4.5%
-
5.0%
]
4.99%
19,7623.6%
[
5.5%
-
6.0%
]
5.60%
26,5475.0%
[
5.5%
-
6.0%
]
5.91%
1,3031.7%
[
6.0%
-
6.5%
]
6.02%
25,2784.5%
[
6.5%
-
7.0%
]
6.88%
13,7042.7%
[
7.5%
-
8.0%
]
7.71%
7782.1%
[
7.5%
-
8.0%
]
7.78%
1,9670.26%
[
7.5%
-
8.0%
]
7.89%
108,4142.5%
[
9.0%
-
9.5%
]
9.28%
1,1325.1%
[
9.5%
-
10.0%
]
9.90%
1,5460.87%
[
12.0%
-
12.5%
]
12.22%
6303.3%
[
12.0%
-
12.5%
]
12.32%
53,0443.1%
[
13.0%
-
13.5%
]
13.03%
43,2133.3%
[
17.0%
-
17.5%
]
17.25%
27,8422.5%
[
19.0%
-
19.5%
]
19.05%
8,9192.4%
[
21.5%
-
22.0%
]
21.97%
5,5264.1%