Immigrants from Northern Europe 1 or more Vehicles in Household
COMPARE
Immigrants from Northern Europe
Select to Compare
1 or more Vehicles in Household
Immigrants from Northern Europe 1 or more Vehicles in Household
89.5%
1+ VEHICLES AVAILABLE
35.5/ 100
METRIC RATING
193rd/ 347
METRIC RANK
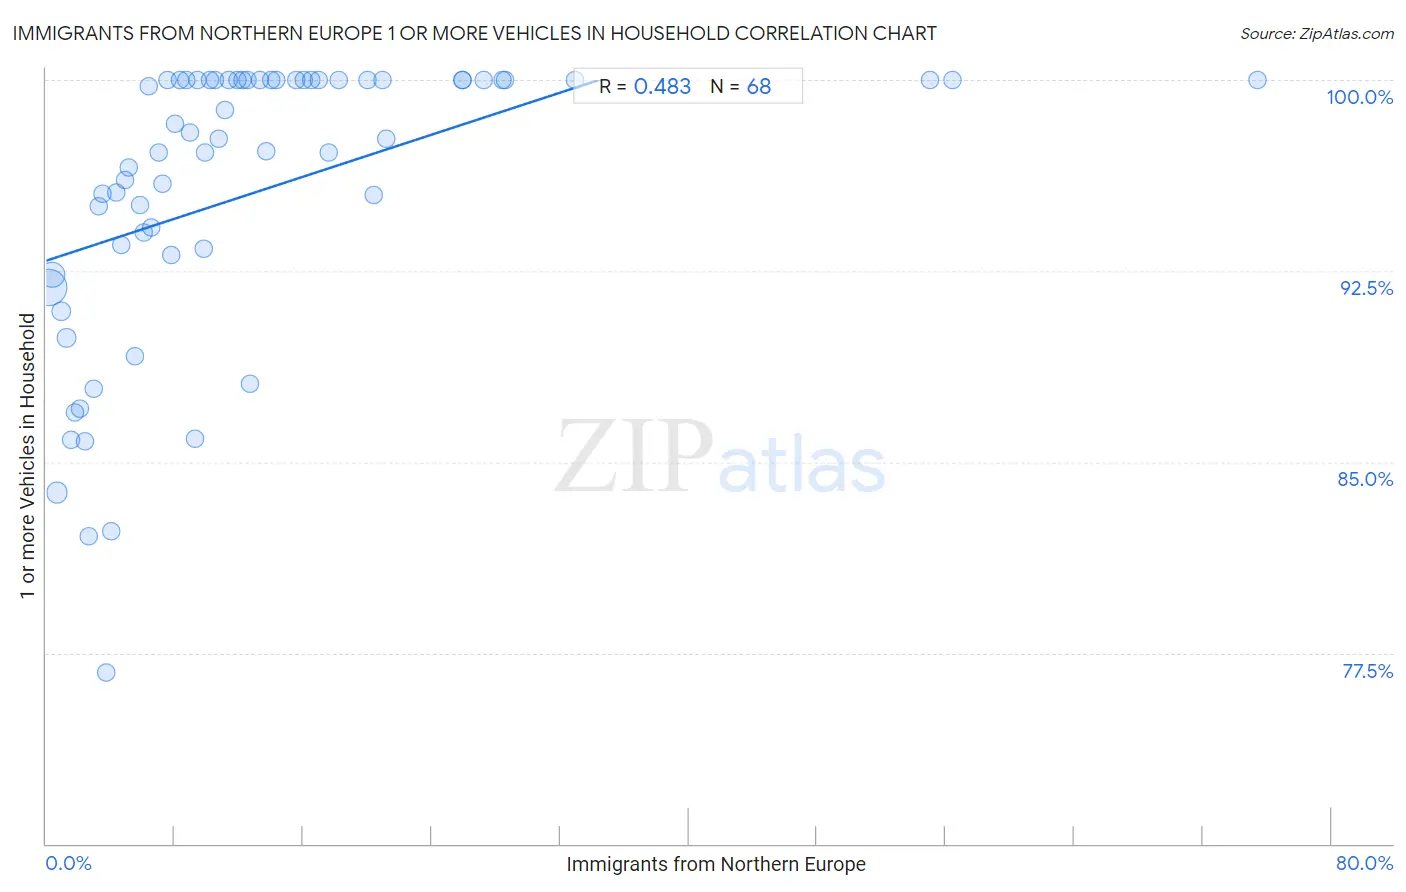
Immigrants from Northern Europe 1 or more Vehicles in Household Correlation Chart
The statistical analysis conducted on geographies consisting of 476,984,908 people shows a moderate positive correlation between the proportion of Immigrants from Northern Europe and percentage of households with 1 or more vehicles available in the United States with a correlation coefficient (R) of 0.483 and weighted average of 89.5%. On average, for every 1% (one percent) increase in Immigrants from Northern Europe within a typical geography, there is an increase of 0.21% in percentage of households with 1 or more vehicles available.
It is essential to understand that the correlation between the percentage of Immigrants from Northern Europe and percentage of households with 1 or more vehicles available does not imply a direct cause-and-effect relationship. It remains uncertain whether the presence of Immigrants from Northern Europe influences an upward or downward trend in the level of percentage of households with 1 or more vehicles available within an area, or if Immigrants from Northern Europe simply ended up residing in those areas with higher or lower levels of percentage of households with 1 or more vehicles available due to other factors.
Demographics Similar to Immigrants from Northern Europe by 1 or more Vehicles in Household
In terms of 1 or more vehicles in household, the demographic groups most similar to Immigrants from Northern Europe are Immigrants from North Macedonia (89.5%, a difference of 0.020%), Shoshone (89.5%, a difference of 0.030%), Immigrants from Poland (89.5%, a difference of 0.030%), Carpatho Rusyn (89.5%, a difference of 0.040%), and Immigrants from Eritrea (89.4%, a difference of 0.040%).
| Demographics | Rating | Rank | 1 or more Vehicles in Household |
| Pueblo | 39.9 /100 | #186 | Fair 89.6% |
| South Americans | 39.6 /100 | #187 | Fair 89.5% |
| Immigrants from Nepal | 38.9 /100 | #188 | Fair 89.5% |
| Carpatho Rusyns | 37.8 /100 | #189 | Fair 89.5% |
| Shoshone | 37.5 /100 | #190 | Fair 89.5% |
| Immigrants from Poland | 37.1 /100 | #191 | Fair 89.5% |
| Immigrants from North Macedonia | 36.5 /100 | #192 | Fair 89.5% |
| Immigrants from Northern Europe | 35.5 /100 | #193 | Fair 89.5% |
| Immigrants from Eritrea | 33.2 /100 | #194 | Fair 89.4% |
| Immigrants from Armenia | 31.8 /100 | #195 | Fair 89.4% |
| Crow | 24.3 /100 | #196 | Fair 89.3% |
| Immigrants from Sweden | 23.6 /100 | #197 | Fair 89.3% |
| Pennsylvania Germans | 22.9 /100 | #198 | Fair 89.3% |
| Immigrants from Asia | 22.8 /100 | #199 | Fair 89.3% |
| Central Americans | 21.4 /100 | #200 | Fair 89.2% |
Immigrants from Northern Europe 1 or more Vehicles in Household Correlation Summary
| Measurement | Immigrants from Northern Europe Data | 1 or more Vehicles in Household Data |
| Minimum | 0.13% | 76.7% |
| Maximum | 75.4% | 100.0% |
| Range | 75.3% | 23.3% |
| Mean | 13.0% | 95.6% |
| Median | 9.6% | 97.7% |
| Interquartile 25% (IQ1) | 4.8% | 93.2% |
| Interquartile 75% (IQ3) | 16.3% | 100.0% |
| Interquartile Range (IQR) | 11.5% | 6.8% |
| Standard Deviation (Sample) | 13.3% | 5.7% |
| Standard Deviation (Population) | 13.2% | 5.6% |
Correlation Details
| Immigrants from Northern Europe Percentile | Sample Size | 1 or more Vehicles in Household |
[ 0.0% - 0.5% ] 0.13% | 272,108,387 | 91.8% |
[ 0.0% - 0.5% ] 0.40% | 115,565,682 | 92.3% |
[ 0.5% - 1.0% ] 0.66% | 50,630,881 | 83.8% |
[ 0.5% - 1.0% ] 0.97% | 18,398,051 | 90.9% |
[ 1.0% - 1.5% ] 1.26% | 8,714,796 | 89.9% |
[ 1.5% - 2.0% ] 1.55% | 5,116,722 | 85.9% |
[ 1.5% - 2.0% ] 1.81% | 2,217,395 | 86.9% |
[ 2.0% - 2.5% ] 2.08% | 1,589,130 | 87.1% |
[ 2.0% - 2.5% ] 2.38% | 760,282 | 85.8% |
[ 2.5% - 3.0% ] 2.68% | 491,411 | 82.1% |
[ 2.5% - 3.0% ] 2.96% | 304,371 | 87.9% |
[ 3.0% - 3.5% ] 3.23% | 264,268 | 95.1% |
[ 3.5% - 4.0% ] 3.52% | 208,292 | 95.5% |
[ 3.5% - 4.0% ] 3.77% | 188,861 | 76.7% |
[ 4.0% - 4.5% ] 4.08% | 94,352 | 82.3% |
[ 4.0% - 4.5% ] 4.34% | 76,025 | 95.6% |
[ 4.5% - 5.0% ] 4.67% | 55,708 | 93.5% |
[ 4.5% - 5.0% ] 4.93% | 26,824 | 96.1% |
[ 5.0% - 5.5% ] 5.15% | 24,427 | 96.6% |
[ 5.0% - 5.5% ] 5.49% | 47,299 | 89.1% |
[ 5.5% - 6.0% ] 5.87% | 24,981 | 95.1% |
[ 6.0% - 6.5% ] 6.07% | 2,406 | 94.0% |
[ 6.0% - 6.5% ] 6.41% | 7,287 | 99.8% |
[ 6.5% - 7.0% ] 6.55% | 18,291 | 94.2% |
[ 6.5% - 7.0% ] 6.97% | 12,287 | 97.1% |
[ 7.0% - 7.5% ] 7.27% | 6,066 | 95.9% |
[ 7.5% - 8.0% ] 7.53% | 3,083 | 100.0% |
[ 7.5% - 8.0% ] 7.76% | 2,462 | 93.1% |
[ 8.0% - 8.5% ] 8.02% | 4,636 | 98.3% |
[ 8.0% - 8.5% ] 8.33% | 876 | 100.0% |
[ 8.5% - 9.0% ] 8.68% | 864 | 100.0% |
[ 8.5% - 9.0% ] 8.97% | 1,483 | 98.0% |
[ 9.0% - 9.5% ] 9.24% | 1,180 | 85.9% |
[ 9.0% - 9.5% ] 9.41% | 999 | 100.0% |
[ 9.5% - 10.0% ] 9.82% | 550 | 93.4% |
[ 9.5% - 10.0% ] 9.92% | 595 | 97.1% |
[ 10.0% - 10.5% ] 10.23% | 567 | 100.0% |
[ 10.0% - 10.5% ] 10.49% | 991 | 100.0% |
[ 10.5% - 11.0% ] 10.76% | 1,264 | 97.7% |
[ 11.0% - 11.5% ] 11.14% | 2,585 | 98.8% |
[ 11.0% - 11.5% ] 11.40% | 623 | 100.0% |
[ 11.5% - 12.0% ] 11.90% | 84 | 100.0% |
[ 12.0% - 12.5% ] 12.22% | 180 | 100.0% |
[ 12.0% - 12.5% ] 12.50% | 40 | 100.0% |
[ 12.5% - 13.0% ] 12.72% | 747 | 88.1% |
[ 13.0% - 13.5% ] 13.33% | 60 | 100.0% |
[ 13.5% - 14.0% ] 13.66% | 366 | 97.2% |
[ 14.0% - 14.5% ] 14.02% | 1,013 | 100.0% |
[ 14.0% - 14.5% ] 14.35% | 230 | 100.0% |
[ 15.5% - 16.0% ] 15.53% | 953 | 100.0% |
[ 16.0% - 16.5% ] 16.04% | 636 | 100.0% |
[ 16.0% - 16.5% ] 16.50% | 491 | 100.0% |
[ 16.5% - 17.0% ] 16.98% | 106 | 100.0% |
[ 17.5% - 18.0% ] 17.61% | 352 | 97.2% |
[ 18.0% - 18.5% ] 18.18% | 55 | 100.0% |
[ 20.0% - 20.5% ] 20.00% | 30 | 100.0% |
[ 20.0% - 20.5% ] 20.35% | 285 | 95.5% |
[ 20.5% - 21.0% ] 20.90% | 244 | 100.0% |
[ 21.0% - 21.5% ] 21.19% | 453 | 97.7% |
[ 25.5% - 26.0% ] 25.93% | 54 | 100.0% |
[ 25.5% - 26.0% ] 25.95% | 185 | 100.0% |
[ 27.0% - 27.5% ] 27.27% | 165 | 100.0% |
[ 28.0% - 28.5% ] 28.41% | 88 | 100.0% |
[ 28.5% - 29.0% ] 28.57% | 21 | 100.0% |
[ 32.5% - 33.0% ] 32.93% | 249 | 100.0% |
[ 55.0% - 55.5% ] 55.00% | 20 | 100.0% |
[ 56.0% - 56.5% ] 56.39% | 321 | 100.0% |
[ 75.0% - 75.5% ] 75.42% | 240 | 100.0% |