Immigrants from Micronesia Female Disability
COMPARE
Immigrants from Micronesia
Select to Compare
Female Disability
Immigrants from Micronesia Female Disability
13.5%
DISABILITY | FEMALES
0.0/ 100
METRIC RATING
304th/ 347
METRIC RANK
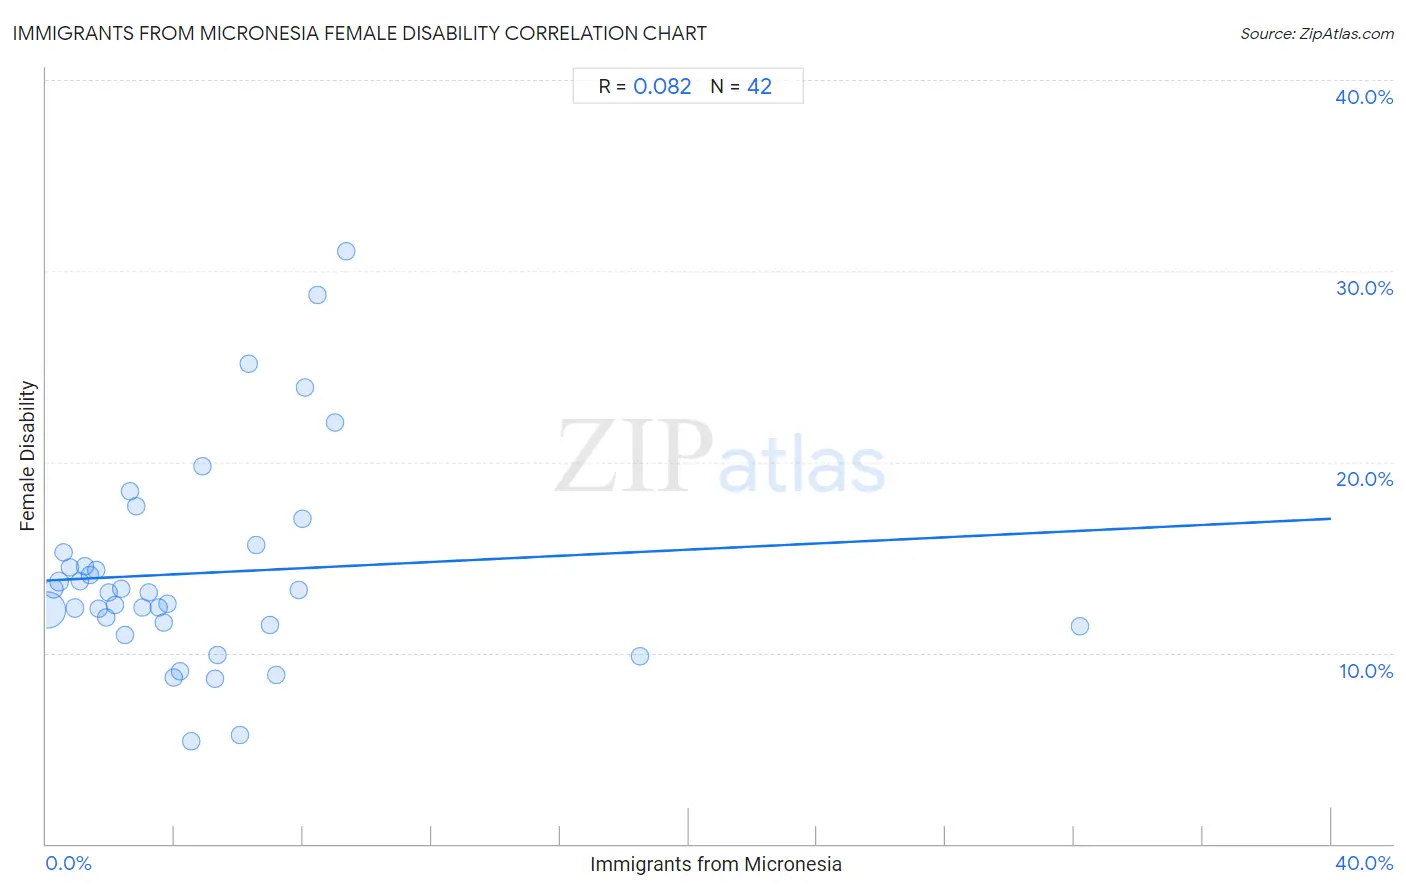
Immigrants from Micronesia Female Disability Correlation Chart
The statistical analysis conducted on geographies consisting of 61,603,210 people shows a slight positive correlation between the proportion of Immigrants from Micronesia and percentage of females with a disability in the United States with a correlation coefficient (R) of 0.082 and weighted average of 13.5%. On average, for every 1% (one percent) increase in Immigrants from Micronesia within a typical geography, there is an increase of 0.081% in percentage of females with a disability.
It is essential to understand that the correlation between the percentage of Immigrants from Micronesia and percentage of females with a disability does not imply a direct cause-and-effect relationship. It remains uncertain whether the presence of Immigrants from Micronesia influences an upward or downward trend in the level of percentage of females with a disability within an area, or if Immigrants from Micronesia simply ended up residing in those areas with higher or lower levels of percentage of females with a disability due to other factors.
Demographics Similar to Immigrants from Micronesia by Female Disability
In terms of female disability, the demographic groups most similar to Immigrants from Micronesia are Scotch-Irish (13.4%, a difference of 0.030%), Immigrants from Portugal (13.5%, a difference of 0.030%), African (13.4%, a difference of 0.17%), Dominican (13.5%, a difference of 0.31%), and Pennsylvania German (13.4%, a difference of 0.37%).
| Demographics | Rating | Rank | Female Disability |
| Slovaks | 0.0 /100 | #297 | Tragic 13.3% |
| Nonimmigrants | 0.0 /100 | #298 | Tragic 13.4% |
| Immigrants from Dominican Republic | 0.0 /100 | #299 | Tragic 13.4% |
| Pennsylvania Germans | 0.0 /100 | #300 | Tragic 13.4% |
| Africans | 0.0 /100 | #301 | Tragic 13.4% |
| Scotch-Irish | 0.0 /100 | #302 | Tragic 13.4% |
| Immigrants from Portugal | 0.0 /100 | #303 | Tragic 13.5% |
| Immigrants from Micronesia | 0.0 /100 | #304 | Tragic 13.5% |
| Dominicans | 0.0 /100 | #305 | Tragic 13.5% |
| French Canadians | 0.0 /100 | #306 | Tragic 13.6% |
| Central American Indians | 0.0 /100 | #307 | Tragic 13.6% |
| Cree | 0.0 /100 | #308 | Tragic 13.7% |
| French American Indians | 0.0 /100 | #309 | Tragic 13.7% |
| Apache | 0.0 /100 | #310 | Tragic 13.7% |
| Hopi | 0.0 /100 | #311 | Tragic 13.7% |
Immigrants from Micronesia Female Disability Correlation Summary
| Measurement | Immigrants from Micronesia Data | Female Disability Data |
| Minimum | 0.022% | 5.4% |
| Maximum | 32.2% | 31.1% |
| Range | 32.1% | 25.7% |
| Mean | 4.9% | 14.2% |
| Median | 3.6% | 13.2% |
| Interquartile 25% (IQ1) | 1.6% | 11.4% |
| Interquartile 75% (IQ3) | 6.5% | 15.3% |
| Interquartile Range (IQR) | 4.9% | 3.8% |
| Standard Deviation (Sample) | 5.5% | 5.4% |
| Standard Deviation (Population) | 5.5% | 5.4% |
Correlation Details
| Immigrants from Micronesia Percentile | Sample Size | Female Disability |
[ 0.0% - 0.5% ] 0.022% | 53,363,867 | 12.2% |
[ 0.0% - 0.5% ] 0.22% | 3,463,820 | 13.3% |
[ 0.0% - 0.5% ] 0.39% | 1,633,111 | 13.7% |
[ 0.5% - 1.0% ] 0.54% | 911,219 | 15.3% |
[ 0.5% - 1.0% ] 0.73% | 521,692 | 14.5% |
[ 0.5% - 1.0% ] 0.90% | 465,458 | 12.3% |
[ 1.0% - 1.5% ] 1.05% | 183,115 | 13.7% |
[ 1.0% - 1.5% ] 1.22% | 79,622 | 14.5% |
[ 1.0% - 1.5% ] 1.35% | 37,868 | 14.0% |
[ 1.5% - 2.0% ] 1.56% | 130,257 | 14.3% |
[ 1.5% - 2.0% ] 1.63% | 382,524 | 12.3% |
[ 1.5% - 2.0% ] 1.86% | 10,989 | 11.9% |
[ 1.5% - 2.0% ] 1.95% | 667 | 13.1% |
[ 2.0% - 2.5% ] 2.13% | 133,478 | 12.5% |
[ 2.0% - 2.5% ] 2.33% | 78,526 | 13.3% |
[ 2.0% - 2.5% ] 2.46% | 1,907 | 10.9% |
[ 2.5% - 3.0% ] 2.59% | 55,473 | 18.5% |
[ 2.5% - 3.0% ] 2.81% | 3,701 | 17.7% |
[ 2.5% - 3.0% ] 2.99% | 8,254 | 12.4% |
[ 3.0% - 3.5% ] 3.19% | 58,742 | 13.2% |
[ 3.0% - 3.5% ] 3.48% | 9,702 | 12.4% |
[ 3.5% - 4.0% ] 3.66% | 9,383 | 11.6% |
[ 3.5% - 4.0% ] 3.79% | 10,786 | 12.6% |
[ 3.5% - 4.0% ] 3.95% | 11,207 | 8.7% |
[ 4.0% - 4.5% ] 4.17% | 624 | 9.0% |
[ 4.5% - 5.0% ] 4.52% | 1,129 | 5.4% |
[ 4.5% - 5.0% ] 4.87% | 10,042 | 19.7% |
[ 5.0% - 5.5% ] 5.26% | 2,356 | 8.6% |
[ 5.0% - 5.5% ] 5.31% | 414 | 9.9% |
[ 6.0% - 6.5% ] 6.04% | 844 | 5.7% |
[ 6.0% - 6.5% ] 6.28% | 2,005 | 25.2% |
[ 6.5% - 7.0% ] 6.52% | 3,801 | 15.7% |
[ 6.5% - 7.0% ] 6.97% | 201 | 11.4% |
[ 7.0% - 7.5% ] 7.14% | 196 | 8.8% |
[ 7.5% - 8.0% ] 7.87% | 4,842 | 13.3% |
[ 7.5% - 8.0% ] 7.96% | 5,391 | 17.0% |
[ 8.0% - 8.5% ] 8.05% | 2,820 | 23.9% |
[ 8.0% - 8.5% ] 8.44% | 379 | 28.7% |
[ 8.5% - 9.0% ] 9.00% | 1,278 | 22.1% |
[ 9.0% - 9.5% ] 9.32% | 429 | 31.1% |
[ 18.0% - 18.5% ] 18.47% | 693 | 9.8% |
[ 32.0% - 32.5% ] 32.16% | 398 | 11.4% |