Immigrants from Honduras 4 or more Vehicles in Household
COMPARE
Immigrants from Honduras
Select to Compare
4 or more Vehicles in Household
Immigrants from Honduras 4 or more Vehicles in Household
6.1%
4+ VEHICLES AVAILABLE
15.4/ 100
METRIC RATING
209th/ 347
METRIC RANK
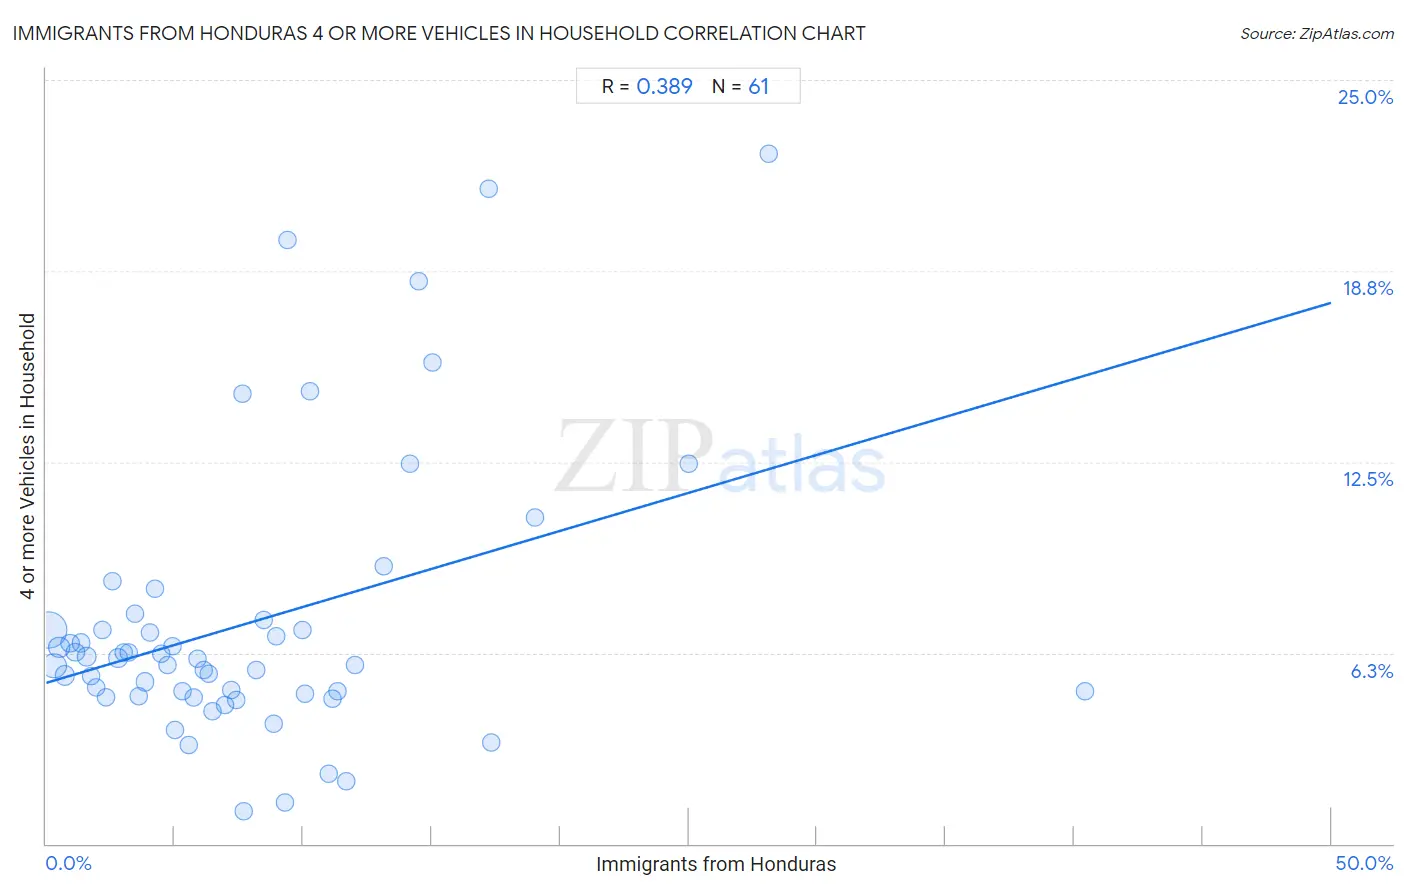
Immigrants from Honduras 4 or more Vehicles in Household Correlation Chart
The statistical analysis conducted on geographies consisting of 321,252,543 people shows a mild positive correlation between the proportion of Immigrants from Honduras and percentage of households with 4 or more vehicles available in the United States with a correlation coefficient (R) of 0.389 and weighted average of 6.1%. On average, for every 1% (one percent) increase in Immigrants from Honduras within a typical geography, there is an increase of 0.25% in percentage of households with 4 or more vehicles available.
It is essential to understand that the correlation between the percentage of Immigrants from Honduras and percentage of households with 4 or more vehicles available does not imply a direct cause-and-effect relationship. It remains uncertain whether the presence of Immigrants from Honduras influences an upward or downward trend in the level of percentage of households with 4 or more vehicles available within an area, or if Immigrants from Honduras simply ended up residing in those areas with higher or lower levels of percentage of households with 4 or more vehicles available due to other factors.
Demographics Similar to Immigrants from Honduras by 4 or more Vehicles in Household
In terms of 4 or more vehicles in household, the demographic groups most similar to Immigrants from Honduras are Immigrants from Nigeria (6.1%, a difference of 0.030%), Immigrants from Zimbabwe (6.0%, a difference of 0.050%), Panamanian (6.0%, a difference of 0.13%), Immigrants from Egypt (6.0%, a difference of 0.15%), and Arab (6.0%, a difference of 0.21%).
| Demographics | Rating | Rank | 4 or more Vehicles in Household |
| Immigrants from South Central Asia | 21.3 /100 | #202 | Fair 6.1% |
| Immigrants from Sierra Leone | 20.5 /100 | #203 | Fair 6.1% |
| Immigrants from Belize | 19.8 /100 | #204 | Poor 6.1% |
| Hondurans | 19.3 /100 | #205 | Poor 6.1% |
| Kenyans | 18.5 /100 | #206 | Poor 6.1% |
| Immigrants from Chile | 16.9 /100 | #207 | Poor 6.1% |
| Immigrants from Nigeria | 15.6 /100 | #208 | Poor 6.1% |
| Immigrants from Honduras | 15.4 /100 | #209 | Poor 6.1% |
| Immigrants from Zimbabwe | 15.1 /100 | #210 | Poor 6.0% |
| Panamanians | 14.8 /100 | #211 | Poor 6.0% |
| Immigrants from Egypt | 14.7 /100 | #212 | Poor 6.0% |
| Arabs | 14.4 /100 | #213 | Poor 6.0% |
| Immigrants from Austria | 14.3 /100 | #214 | Poor 6.0% |
| Immigrants from China | 13.8 /100 | #215 | Poor 6.0% |
| Immigrants from Romania | 13.8 /100 | #216 | Poor 6.0% |
Immigrants from Honduras 4 or more Vehicles in Household Correlation Summary
| Measurement | Immigrants from Honduras Data | 4 or more Vehicles in Household Data |
| Minimum | 0.086% | 1.1% |
| Maximum | 40.4% | 22.6% |
| Range | 40.3% | 21.5% |
| Mean | 8.0% | 7.3% |
| Median | 6.3% | 6.1% |
| Interquartile 25% (IQ1) | 3.1% | 4.9% |
| Interquartile 75% (IQ3) | 10.6% | 7.2% |
| Interquartile Range (IQR) | 7.5% | 2.3% |
| Standard Deviation (Sample) | 7.2% | 4.6% |
| Standard Deviation (Population) | 7.1% | 4.6% |
Correlation Details
| Immigrants from Honduras Percentile | Sample Size | 4 or more Vehicles in Household |
[ 0.0% - 0.5% ] 0.086% | 174,526,443 | 7.0% |
[ 0.0% - 0.5% ] 0.31% | 65,668,657 | 5.8% |
[ 0.5% - 1.0% ] 0.50% | 26,874,168 | 6.4% |
[ 0.5% - 1.0% ] 0.72% | 15,530,401 | 5.5% |
[ 0.5% - 1.0% ] 0.94% | 9,503,355 | 6.6% |
[ 1.0% - 1.5% ] 1.13% | 4,906,829 | 6.3% |
[ 1.0% - 1.5% ] 1.34% | 4,073,923 | 6.6% |
[ 1.5% - 2.0% ] 1.57% | 3,858,705 | 6.1% |
[ 1.5% - 2.0% ] 1.76% | 2,987,458 | 5.5% |
[ 1.5% - 2.0% ] 1.96% | 1,712,674 | 5.1% |
[ 2.0% - 2.5% ] 2.17% | 1,311,760 | 7.0% |
[ 2.0% - 2.5% ] 2.32% | 3,452,939 | 4.8% |
[ 2.5% - 3.0% ] 2.57% | 1,122,288 | 8.6% |
[ 2.5% - 3.0% ] 2.79% | 1,262,590 | 6.1% |
[ 3.0% - 3.5% ] 3.02% | 412,261 | 6.3% |
[ 3.0% - 3.5% ] 3.22% | 310,136 | 6.3% |
[ 3.0% - 3.5% ] 3.45% | 189,547 | 7.5% |
[ 3.5% - 4.0% ] 3.60% | 462,275 | 4.8% |
[ 3.5% - 4.0% ] 3.87% | 223,279 | 5.3% |
[ 4.0% - 4.5% ] 4.04% | 266,314 | 6.9% |
[ 4.0% - 4.5% ] 4.24% | 350,968 | 8.3% |
[ 4.0% - 4.5% ] 4.45% | 237,346 | 6.2% |
[ 4.5% - 5.0% ] 4.72% | 58,406 | 5.9% |
[ 4.5% - 5.0% ] 4.89% | 124,604 | 6.5% |
[ 5.0% - 5.5% ] 5.02% | 553,716 | 3.7% |
[ 5.0% - 5.5% ] 5.29% | 61,328 | 5.0% |
[ 5.5% - 6.0% ] 5.52% | 136,073 | 3.2% |
[ 5.5% - 6.0% ] 5.76% | 197,284 | 4.8% |
[ 5.5% - 6.0% ] 5.86% | 133,083 | 6.1% |
[ 6.0% - 6.5% ] 6.11% | 38,581 | 5.7% |
[ 6.0% - 6.5% ] 6.30% | 54,266 | 5.6% |
[ 6.0% - 6.5% ] 6.48% | 76,752 | 4.4% |
[ 6.5% - 7.0% ] 6.94% | 2,220 | 4.5% |
[ 7.0% - 7.5% ] 7.20% | 32,233 | 5.0% |
[ 7.0% - 7.5% ] 7.37% | 41,853 | 4.7% |
[ 7.5% - 8.0% ] 7.63% | 2,410 | 14.7% |
[ 7.5% - 8.0% ] 7.71% | 33,614 | 1.1% |
[ 8.0% - 8.5% ] 8.17% | 45,390 | 5.7% |
[ 8.0% - 8.5% ] 8.48% | 38,342 | 7.3% |
[ 8.5% - 9.0% ] 8.87% | 46,203 | 3.9% |
[ 8.5% - 9.0% ] 8.95% | 20,266 | 6.8% |
[ 9.0% - 9.5% ] 9.27% | 52,360 | 1.4% |
[ 9.0% - 9.5% ] 9.37% | 896 | 19.8% |
[ 9.5% - 10.0% ] 9.95% | 46,266 | 7.0% |
[ 10.0% - 10.5% ] 10.09% | 2,547 | 4.9% |
[ 10.0% - 10.5% ] 10.28% | 8,071 | 14.8% |
[ 11.0% - 11.5% ] 11.01% | 8,750 | 2.3% |
[ 11.0% - 11.5% ] 11.13% | 66,326 | 4.8% |
[ 11.0% - 11.5% ] 11.32% | 59,121 | 5.0% |
[ 11.5% - 12.0% ] 11.66% | 16,743 | 2.0% |
[ 12.0% - 12.5% ] 12.01% | 26,105 | 5.8% |
[ 13.0% - 13.5% ] 13.13% | 7,385 | 9.1% |
[ 14.0% - 14.5% ] 14.14% | 6,947 | 12.5% |
[ 14.5% - 15.0% ] 14.50% | 1,303 | 18.4% |
[ 15.0% - 15.5% ] 15.03% | 3,559 | 15.7% |
[ 17.0% - 17.5% ] 17.21% | 1,714 | 21.5% |
[ 17.0% - 17.5% ] 17.32% | 976 | 3.3% |
[ 18.5% - 19.0% ] 19.00% | 679 | 10.7% |
[ 25.0% - 25.5% ] 25.00% | 1,556 | 12.4% |
[ 28.0% - 28.5% ] 28.12% | 64 | 22.6% |
[ 40.0% - 40.5% ] 40.43% | 235 | 5.0% |