Hawaiian vs Immigrants from South Eastern Asia Married-Couple Family Poverty
COMPARE
Hawaiian
Immigrants from South Eastern Asia
Married-Couple Family Poverty
Married-Couple Family Poverty Comparison
Hawaiians
Immigrants from South Eastern Asia
5.1%
MARRIED-COUPLE FAMILY POVERTY
62.3/ 100
METRIC RATING
164th/ 347
METRIC RANK
5.1%
MARRIED-COUPLE FAMILY POVERTY
70.4/ 100
METRIC RATING
158th/ 347
METRIC RANK
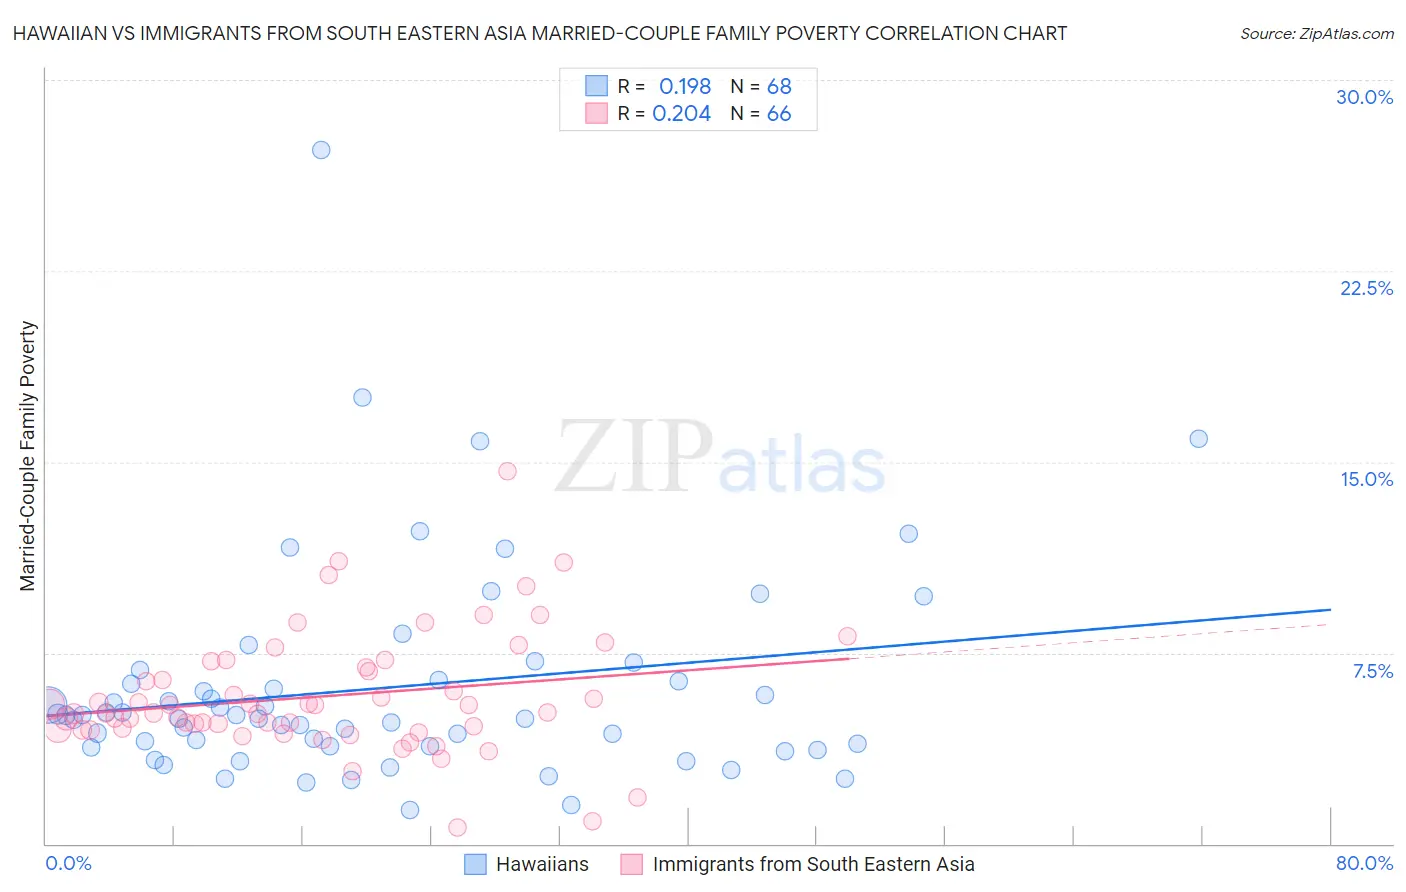
Hawaiian vs Immigrants from South Eastern Asia Married-Couple Family Poverty Correlation Chart
The statistical analysis conducted on geographies consisting of 325,605,449 people shows a poor positive correlation between the proportion of Hawaiians and poverty level among married-couple families in the United States with a correlation coefficient (R) of 0.198 and weighted average of 5.1%. Similarly, the statistical analysis conducted on geographies consisting of 504,926,469 people shows a weak positive correlation between the proportion of Immigrants from South Eastern Asia and poverty level among married-couple families in the United States with a correlation coefficient (R) of 0.204 and weighted average of 5.1%, a difference of 1.1%.
Married-Couple Family Poverty Correlation Summary
| Measurement | Hawaiian | Immigrants from South Eastern Asia |
| Minimum | 1.3% | 0.63% |
| Maximum | 27.3% | 14.6% |
| Range | 26.0% | 14.0% |
| Mean | 6.1% | 5.8% |
| Median | 5.0% | 5.1% |
| Interquartile 25% (IQ1) | 3.8% | 4.5% |
| Interquartile 75% (IQ3) | 6.4% | 6.9% |
| Interquartile Range (IQR) | 2.6% | 2.4% |
| Standard Deviation (Sample) | 4.2% | 2.4% |
| Standard Deviation (Population) | 4.2% | 2.4% |
Demographics Similar to Hawaiians and Immigrants from South Eastern Asia by Married-Couple Family Poverty
In terms of married-couple family poverty, the demographic groups most similar to Hawaiians are Immigrants from Malaysia (5.1%, a difference of 0.010%), Paraguayan (5.1%, a difference of 0.10%), Costa Rican (5.1%, a difference of 0.10%), Sierra Leonean (5.1%, a difference of 0.24%), and Immigrants from Jordan (5.1%, a difference of 0.55%). Similarly, the demographic groups most similar to Immigrants from South Eastern Asia are Immigrants from Saudi Arabia (5.1%, a difference of 0.0%), Argentinean (5.1%, a difference of 0.050%), Pennsylvania German (5.1%, a difference of 0.26%), Sri Lankan (5.1%, a difference of 0.27%), and Immigrants from Ethiopia (5.1%, a difference of 0.31%).
| Demographics | Rating | Rank | Married-Couple Family Poverty |
| Immigrants | Cameroon | 77.3 /100 | #151 | Good 5.0% |
| Albanians | 77.2 /100 | #152 | Good 5.0% |
| Immigrants | Kuwait | 76.3 /100 | #153 | Good 5.0% |
| Delaware | 73.7 /100 | #154 | Good 5.1% |
| Immigrants | Ethiopia | 72.4 /100 | #155 | Good 5.1% |
| Sri Lankans | 72.2 /100 | #156 | Good 5.1% |
| Argentineans | 70.7 /100 | #157 | Good 5.1% |
| Immigrants | South Eastern Asia | 70.4 /100 | #158 | Good 5.1% |
| Immigrants | Saudi Arabia | 70.3 /100 | #159 | Good 5.1% |
| Pennsylvania Germans | 68.5 /100 | #160 | Good 5.1% |
| Ethiopians | 68.1 /100 | #161 | Good 5.1% |
| Immigrants | Jordan | 66.5 /100 | #162 | Good 5.1% |
| Sierra Leoneans | 64.1 /100 | #163 | Good 5.1% |
| Hawaiians | 62.3 /100 | #164 | Good 5.1% |
| Immigrants | Malaysia | 62.2 /100 | #165 | Good 5.1% |
| Paraguayans | 61.5 /100 | #166 | Good 5.1% |
| Costa Ricans | 61.5 /100 | #167 | Good 5.1% |
| Immigrants | Uganda | 54.9 /100 | #168 | Average 5.2% |
| Ottawa | 54.5 /100 | #169 | Average 5.2% |
| Immigrants | Argentina | 54.4 /100 | #170 | Average 5.2% |
| Bermudans | 52.9 /100 | #171 | Average 5.2% |