Colville Married-couple Households
COMPARE
Colville
Select to Compare
Married-couple Households
Colville Married-couple Households
41.0%
MARRIED-COUPLE HOUSEHOLDS
0.0/ 100
METRIC RATING
311th/ 347
METRIC RANK
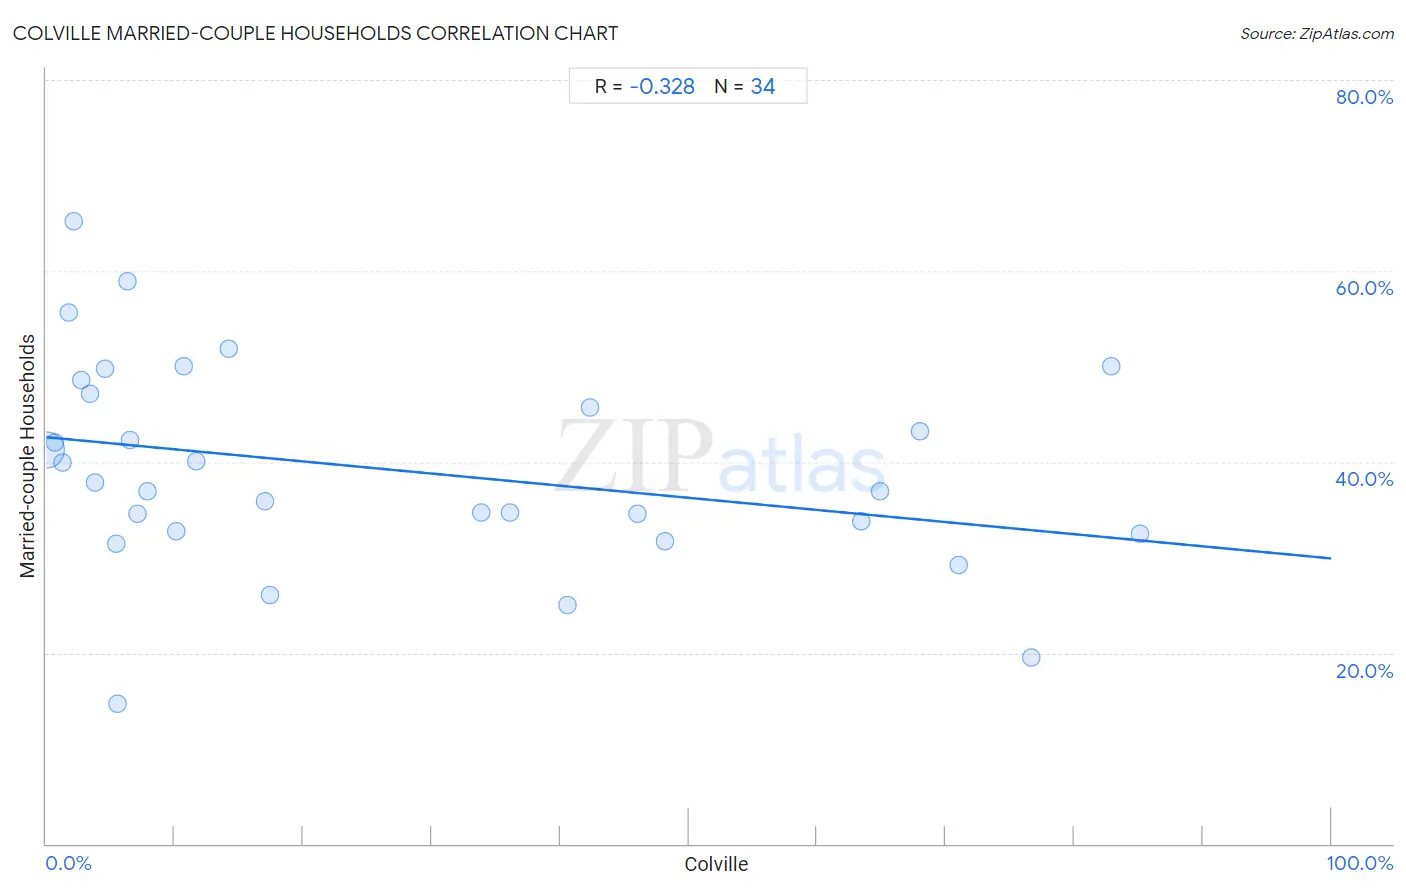
Colville Married-couple Households Correlation Chart
The statistical analysis conducted on geographies consisting of 34,682,856 people shows a mild negative correlation between the proportion of Colville and percentage of married-couple family households in the United States with a correlation coefficient (R) of -0.328 and weighted average of 41.0%. On average, for every 1% (one percent) increase in Colville within a typical geography, there is a decrease of 0.13% in percentage of married-couple family households.
It is essential to understand that the correlation between the percentage of Colville and percentage of married-couple family households does not imply a direct cause-and-effect relationship. It remains uncertain whether the presence of Colville influences an upward or downward trend in the level of percentage of married-couple family households within an area, or if Colville simply ended up residing in those areas with higher or lower levels of percentage of married-couple family households due to other factors.
Demographics Similar to Colville by Married-couple Households
In terms of married-couple households, the demographic groups most similar to Colville are African (40.9%, a difference of 0.090%), Immigrants from Haiti (40.9%, a difference of 0.15%), Jamaican (40.9%, a difference of 0.22%), Trinidadian and Tobagonian (40.9%, a difference of 0.30%), and Immigrants from Caribbean (40.8%, a difference of 0.49%).
| Demographics | Rating | Rank | Married-couple Households |
| Immigrants from Guyana | 0.0 /100 | #304 | Tragic 41.6% |
| Sioux | 0.0 /100 | #305 | Tragic 41.5% |
| Guyanese | 0.0 /100 | #306 | Tragic 41.4% |
| Immigrants from Western Africa | 0.0 /100 | #307 | Tragic 41.4% |
| Crow | 0.0 /100 | #308 | Tragic 41.4% |
| Immigrants from Trinidad and Tobago | 0.0 /100 | #309 | Tragic 41.2% |
| Haitians | 0.0 /100 | #310 | Tragic 41.2% |
| Colville | 0.0 /100 | #311 | Tragic 41.0% |
| Africans | 0.0 /100 | #312 | Tragic 40.9% |
| Immigrants from Haiti | 0.0 /100 | #313 | Tragic 40.9% |
| Jamaicans | 0.0 /100 | #314 | Tragic 40.9% |
| Trinidadians and Tobagonians | 0.0 /100 | #315 | Tragic 40.9% |
| Immigrants from Caribbean | 0.0 /100 | #316 | Tragic 40.8% |
| Immigrants from Jamaica | 0.0 /100 | #317 | Tragic 40.7% |
| Liberians | 0.0 /100 | #318 | Tragic 40.7% |
Colville Married-couple Households Correlation Summary
| Measurement | Colville Data | Married-couple Households Data |
| Minimum | 0.026% | 14.7% |
| Maximum | 85.1% | 65.2% |
| Range | 85.1% | 50.6% |
| Mean | 26.4% | 39.2% |
| Median | 11.2% | 37.4% |
| Interquartile 25% (IQ1) | 4.5% | 32.8% |
| Interquartile 75% (IQ3) | 46.0% | 47.2% |
| Interquartile Range (IQR) | 41.5% | 14.4% |
| Standard Deviation (Sample) | 28.0% | 10.8% |
| Standard Deviation (Population) | 27.6% | 10.7% |
Correlation Details
| Colville Percentile | Sample Size | Married-couple Households |
[ 0.0% - 0.5% ] 0.026% | 34,436,478 | 41.2% |
[ 0.5% - 1.0% ] 0.64% | 127,711 | 42.0% |
[ 1.0% - 1.5% ] 1.28% | 35,844 | 39.9% |
[ 1.5% - 2.0% ] 1.70% | 13,619 | 55.7% |
[ 2.0% - 2.5% ] 2.11% | 17,953 | 65.2% |
[ 2.5% - 3.0% ] 2.74% | 5,867 | 48.5% |
[ 3.0% - 3.5% ] 3.37% | 5,404 | 47.2% |
[ 3.5% - 4.0% ] 3.83% | 4,957 | 37.9% |
[ 4.5% - 5.0% ] 4.55% | 5,587 | 49.7% |
[ 5.0% - 5.5% ] 5.44% | 643 | 31.4% |
[ 5.5% - 6.0% ] 5.53% | 561 | 14.7% |
[ 6.0% - 6.5% ] 6.32% | 918 | 58.9% |
[ 6.5% - 7.0% ] 6.56% | 5,456 | 42.3% |
[ 7.0% - 7.5% ] 7.09% | 127 | 34.6% |
[ 7.5% - 8.0% ] 7.92% | 1,098 | 36.9% |
[ 10.0% - 10.5% ] 10.15% | 1,034 | 32.8% |
[ 10.5% - 11.0% ] 10.66% | 122 | 50.0% |
[ 11.5% - 12.0% ] 11.68% | 865 | 40.1% |
[ 14.0% - 14.5% ] 14.22% | 9,218 | 51.8% |
[ 16.5% - 17.0% ] 16.99% | 1,377 | 35.8% |
[ 17.0% - 17.5% ] 17.45% | 424 | 26.0% |
[ 33.5% - 34.0% ] 33.81% | 1,538 | 34.6% |
[ 36.0% - 36.5% ] 36.06% | 1,334 | 34.6% |
[ 40.5% - 41.0% ] 40.54% | 74 | 25.0% |
[ 42.0% - 42.5% ] 42.28% | 395 | 45.7% |
[ 46.0% - 46.5% ] 46.01% | 276 | 34.5% |
[ 48.0% - 48.5% ] 48.15% | 270 | 31.6% |
[ 63.0% - 63.5% ] 63.38% | 568 | 33.7% |
[ 64.5% - 65.0% ] 64.91% | 1,103 | 36.9% |
[ 67.5% - 68.0% ] 67.97% | 256 | 43.2% |
[ 70.5% - 71.0% ] 70.97% | 155 | 29.2% |
[ 76.5% - 77.0% ] 76.66% | 977 | 19.5% |
[ 82.5% - 83.0% ] 82.84% | 338 | 50.0% |
[ 85.0% - 85.5% ] 85.11% | 309 | 32.5% |