Zip Codes with the Highest Percentage of Population with a Degree in Literature and Languages in Puyallup, WA

RELATED REPORTS & OPTIONS

Literature and Languages
Population
Families and Households
Female Fertility
Female Fertility (Unmarried)
Race (Community Size)
Race (Percentage)
Ancestry (Community Size)
AfricanAleutAmericanApacheArabArgentineanAustralianAustrianBelgianBhutaneseBlackfeetBritishBulgarianBurmeseCanadianCentral AmericanCentral American IndianCherokeeChickasawChileanChippewaChoctawColombianColvilleCreeCroatianCubanCzechCzechoslovakianDanishDominicanDutchEastern EuropeanEgyptianEnglishEstonianEthiopianEuropeanFilipinoFinnishFrenchFrench American IndianFrench CanadianGermanGreekGuamanian / ChamorroGuatemalanHonduranHungarianIcelanderIndian (Asian)IndonesianIranianIraqiIrishIroquoisItalianJamaicanJapaneseKenyanKoreanLatvianLebaneseLithuanianMalaysianMexicanMexican American IndianMoroccanNative HawaiianNicaraguanNigerianNorthern EuropeanNorwegianPakistaniPalestinianPanamanianPennsylvania GermanPeruvianPolishPortuguesePotawatomiPuerto RicanPuget Sound SalishRomanianRussianSalvadoranSamoanScandinavianScotch-IrishScottishSerbianSiouxSlavicSlovakSloveneSouth AfricanSouth AmericanSouth American IndianSpaniardSpanishSri LankanSubsaharan AfricanSwedishSwissThaiTonganTrinidadian and TobagonianUkrainianVenezuelanWelshWest IndianYakamaYaquiYugoslavian
Ancestry (Percentage)
AfricanAleutAmericanApacheArabArgentineanAustralianAustrianBelgianBhutaneseBlackfeetBritishBulgarianBurmeseCanadianCentral AmericanCentral American IndianCherokeeChickasawChileanChippewaChoctawColombianColvilleCreeCroatianCubanCzechCzechoslovakianDanishDominicanDutchEastern EuropeanEgyptianEnglishEstonianEthiopianEuropeanFilipinoFinnishFrenchFrench American IndianFrench CanadianGermanGreekGuamanian / ChamorroGuatemalanHonduranHungarianIcelanderIndian (Asian)IndonesianIranianIraqiIrishIroquoisItalianJamaicanJapaneseKenyanKoreanLatvianLebaneseLithuanianMalaysianMexicanMexican American IndianMoroccanNative HawaiianNicaraguanNigerianNorthern EuropeanNorwegianPakistaniPalestinianPanamanianPennsylvania GermanPeruvianPolishPortuguesePotawatomiPuerto RicanPuget Sound SalishRomanianRussianSalvadoranSamoanScandinavianScotch-IrishScottishSerbianSiouxSlavicSlovakSloveneSouth AfricanSouth AmericanSouth American IndianSpaniardSpanishSri LankanSubsaharan AfricanSwedishSwissThaiTonganTrinidadian and TobagonianUkrainianVenezuelanWelshWest IndianYakamaYaquiYugoslavian
Immigrant Origin (Total)
Immigrant Origin (Percentage)
Income
Income (Families)
Income (Households)
Poverty
Poverty (Families)
Unemployment
Employment Occupations
Employment Industries
Employer Class
Commute Time
Commute Means
School Enrollment
Education by Degree Field
Occupancy
Finances
Physical Characteristics
Puyallup
Compare Zip Codes
Comparison Subject

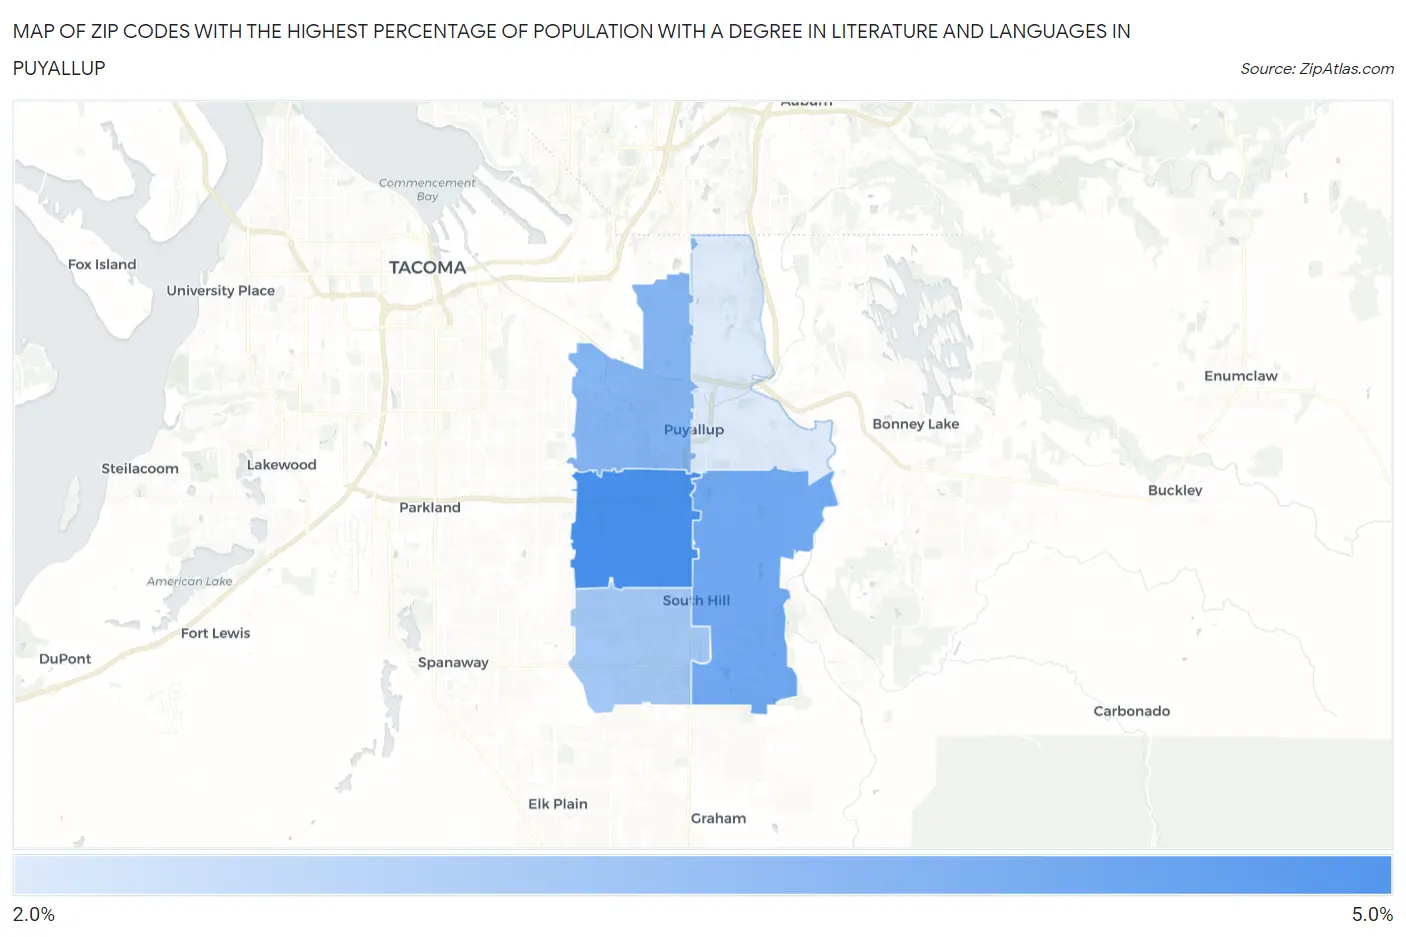
Map of Zip Codes with the Highest Percentage of Population with a Degree in Literature and Languages in Puyallup

0.0%
5.0%
Zip Codes with the Highest Percentage of Population with a Degree in Literature and Languages in Puyallup Map

Zip Codes with the Highest Percentage of Population with a Degree in Literature and Languages in Puyallup, WA

Zip Code % Graduates vs State vs National
1.983734.8%5.3%(-0.465)#2114.4%(+0.409)#7,848
2.983744.1%5.3%(-1.19)#2604.4%(-0.312)#9,923
3.983713.8%5.3%(-1.49)#2754.4%(-0.619)#10,851
4.983753.2%5.3%(-2.05)#3144.4%(-1.17)#12,768
5.983722.3%5.3%(-3.03)#3684.4%(-2.15)#16,202

Common Questions

What are the Top 3 Zip Codes with the Highest Percentage of Population with a Degree in Literature and Languages in Puyallup, WA?
Top 3 Zip Codes with the Highest Percentage of Population with a Degree in Literature and Languages in Puyallup, WA are:
#1
4.8%
#2
4.1%
#3
3.8%
What zip code has the Highest Percentage of Population with a Degree in Literature and Languages in Puyallup, WA?
98373 has the Highest Percentage of Population with a Degree in Literature and Languages in Puyallup, WA with 4.8%.
What is the Percentage of Population with a Degree in Literature and Languages in Puyallup, WA?
Percentage of Population with a Degree in Literature and Languages in Puyallup is 4.0%.
What is the Percentage of Population with a Degree in Literature and Languages in Washington?
Percentage of Population with a Degree in Literature and Languages in Washington is 5.3%.
What is the Percentage of Population with a Degree in Literature and Languages in the United States?
Percentage of Population with a Degree in Literature and Languages in the United States is 4.4%.