Zip Codes with the Highest Percentage of Population Employed in Community & Social Service in Puyallup, WA
RELATED REPORTS & OPTIONS
Community & Social Service
Puyallup
Compare Zip Codes
Map of Zip Codes with the Highest Percentage of Population Employed in Community & Social Service in Puyallup
8.9%
11.6%
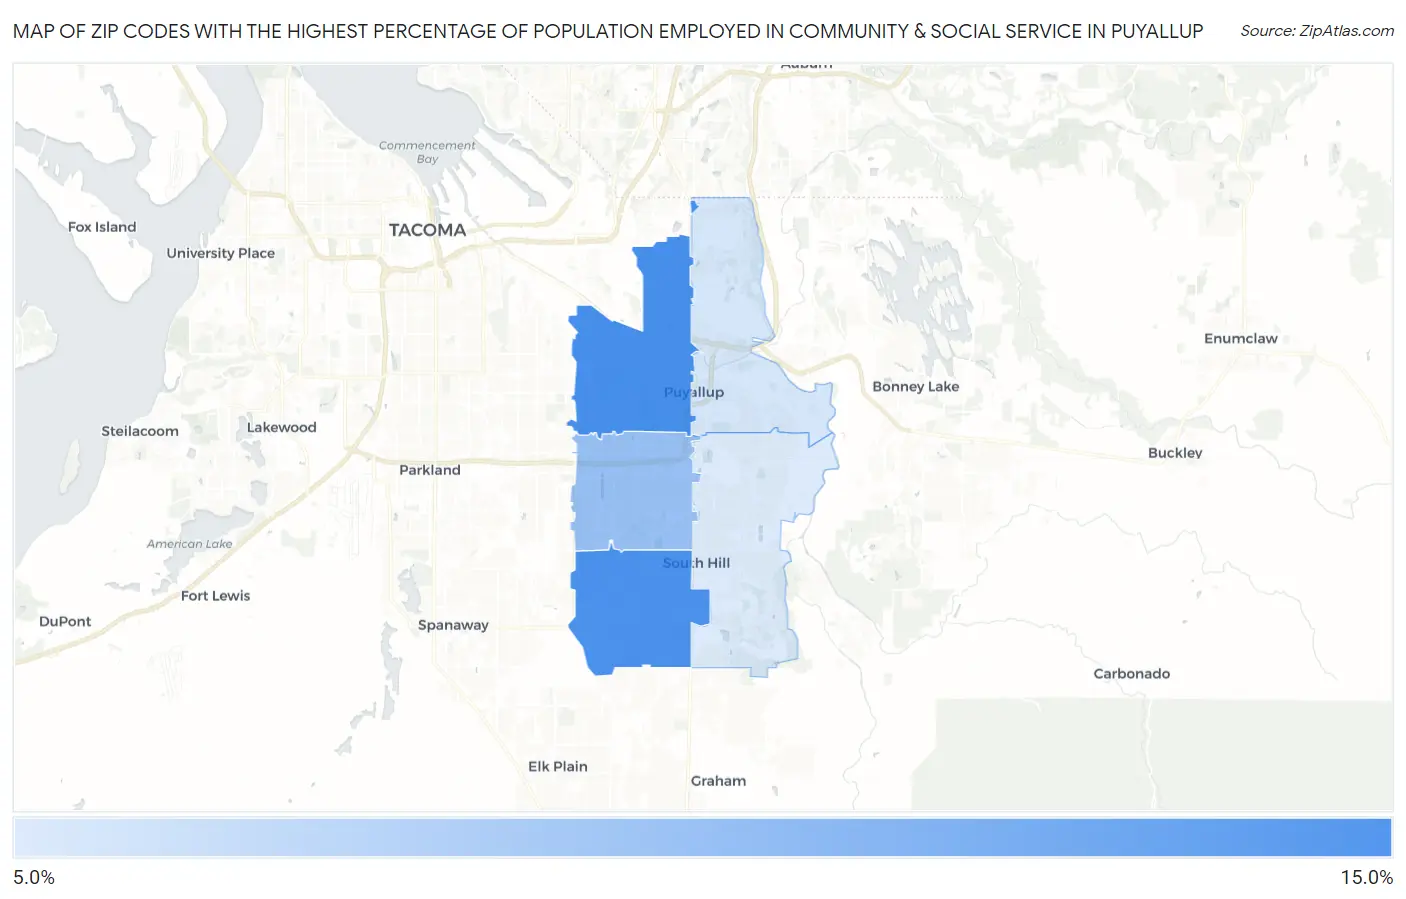
Zip Codes with the Highest Percentage of Population Employed in Community & Social Service in Puyallup, WA
| Zip Code | % Employed | vs State | vs National | |
| 1. | 98371 | 11.6% | 10.7%(+0.880)#210 | 11.2%(+0.383)#10,234 |
| 2. | 98375 | 11.5% | 10.7%(+0.815)#212 | 11.2%(+0.319)#10,381 |
| 3. | 98373 | 10.2% | 10.7%(-0.557)#279 | 11.2%(-1.05)#13,713 |
| 4. | 98372 | 9.1% | 10.7%(-1.64)#348 | 11.2%(-2.14)#16,616 |
| 5. | 98374 | 8.9% | 10.7%(-1.78)#356 | 11.2%(-2.27)#16,989 |
1
Common Questions
What are the Top 3 Zip Codes with the Highest Percentage of Population Employed in Community & Social Service in Puyallup, WA?
Top 3 Zip Codes with the Highest Percentage of Population Employed in Community & Social Service in Puyallup, WA are:
What zip code has the Highest Percentage of Population Employed in Community & Social Service in Puyallup, WA?
98371 has the Highest Percentage of Population Employed in Community & Social Service in Puyallup, WA with 11.6%.
What is the Percentage of Population Employed in Community & Social Service in Puyallup, WA?
Percentage of Population Employed in Community & Social Service in Puyallup is 10.4%.
What is the Percentage of Population Employed in Community & Social Service in Washington?
Percentage of Population Employed in Community & Social Service in Washington is 10.7%.
What is the Percentage of Population Employed in Community & Social Service in the United States?
Percentage of Population Employed in Community & Social Service in the United States is 11.2%.