Zip Codes with the Highest Percentage of Population Employed in Transportation & Warehousing in Puyallup, WA
RELATED REPORTS & OPTIONS
Transportation & Warehousing
Puyallup
Compare Zip Codes
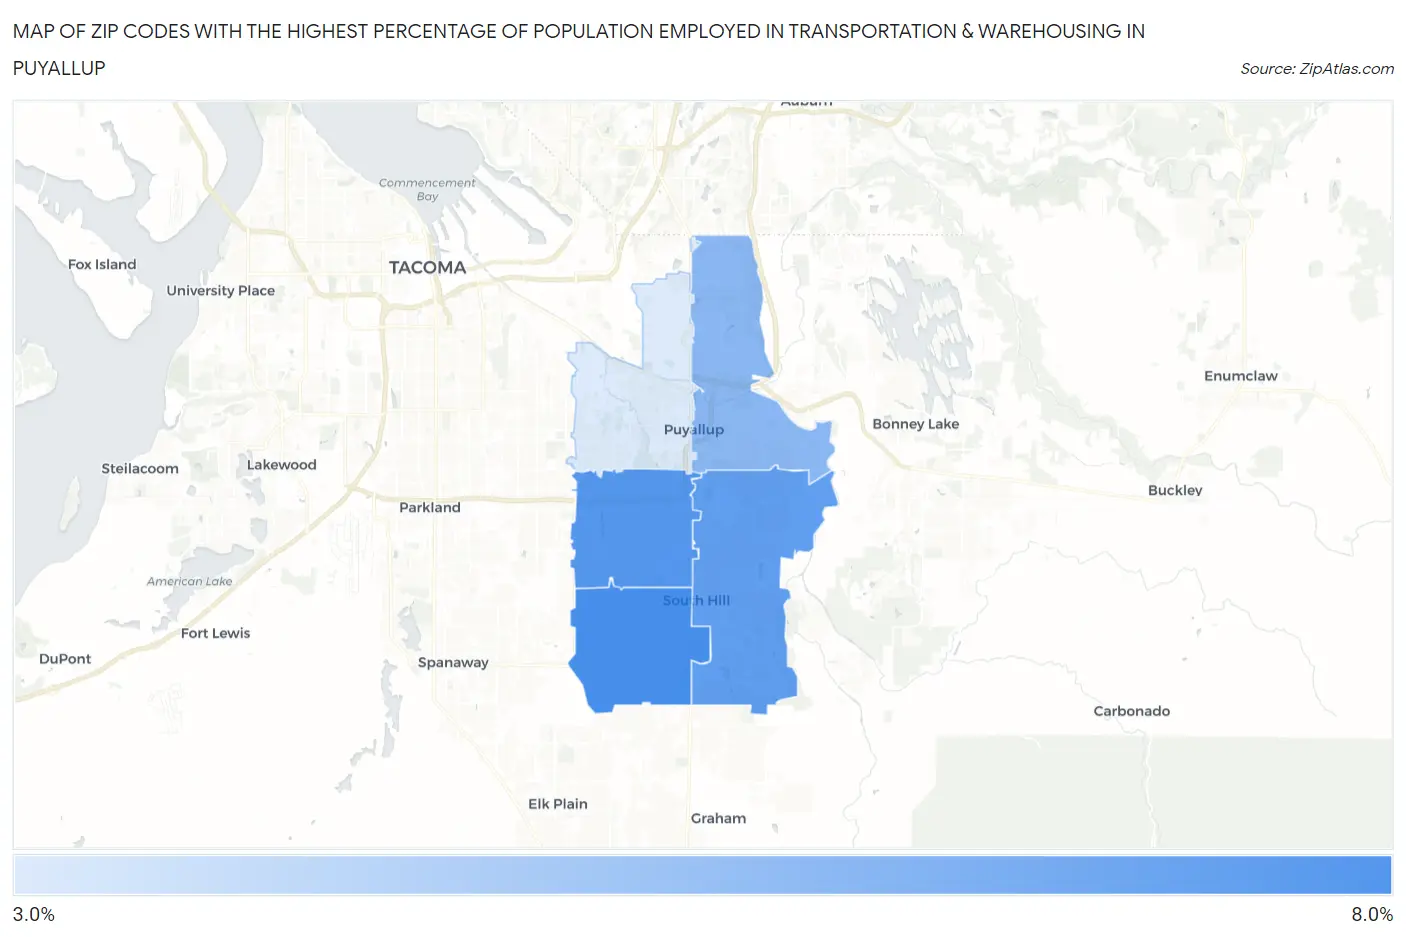
Map of Zip Codes with the Highest Percentage of Population Employed in Transportation & Warehousing in Puyallup
3.6%
7.7%
Zip Codes with the Highest Percentage of Population Employed in Transportation & Warehousing in Puyallup, WA
| Zip Code | % Employed | vs State | vs National | |
| 1. | 98375 | 7.7% | 4.9%(+2.80)#96 | 4.9%(+2.77)#5,302 |
| 2. | 98373 | 7.3% | 4.9%(+2.41)#104 | 4.9%(+2.38)#5,953 |
| 3. | 98374 | 7.0% | 4.9%(+2.10)#116 | 4.9%(+2.07)#6,531 |
| 4. | 98372 | 5.9% | 4.9%(+0.981)#164 | 4.9%(+0.949)#9,037 |
| 5. | 98371 | 3.6% | 4.9%(-1.28)#307 | 4.9%(-1.31)#17,510 |
1
Common Questions
What are the Top 3 Zip Codes with the Highest Percentage of Population Employed in Transportation & Warehousing in Puyallup, WA?
Top 3 Zip Codes with the Highest Percentage of Population Employed in Transportation & Warehousing in Puyallup, WA are:
What zip code has the Highest Percentage of Population Employed in Transportation & Warehousing in Puyallup, WA?
98375 has the Highest Percentage of Population Employed in Transportation & Warehousing in Puyallup, WA with 7.7%.
What is the Percentage of Population Employed in Transportation & Warehousing in Puyallup, WA?
Percentage of Population Employed in Transportation & Warehousing in Puyallup is 5.8%.
What is the Percentage of Population Employed in Transportation & Warehousing in Washington?
Percentage of Population Employed in Transportation & Warehousing in Washington is 4.9%.
What is the Percentage of Population Employed in Transportation & Warehousing in the United States?
Percentage of Population Employed in Transportation & Warehousing in the United States is 4.9%.