Zip Codes with the Highest Percentage of Population Employed in Office & Administration in Puyallup, WA
RELATED REPORTS & OPTIONS
Office & Administration
Puyallup
Compare Zip Codes
Map of Zip Codes with the Highest Percentage of Population Employed in Office & Administration in Puyallup
9.3%
14.3%
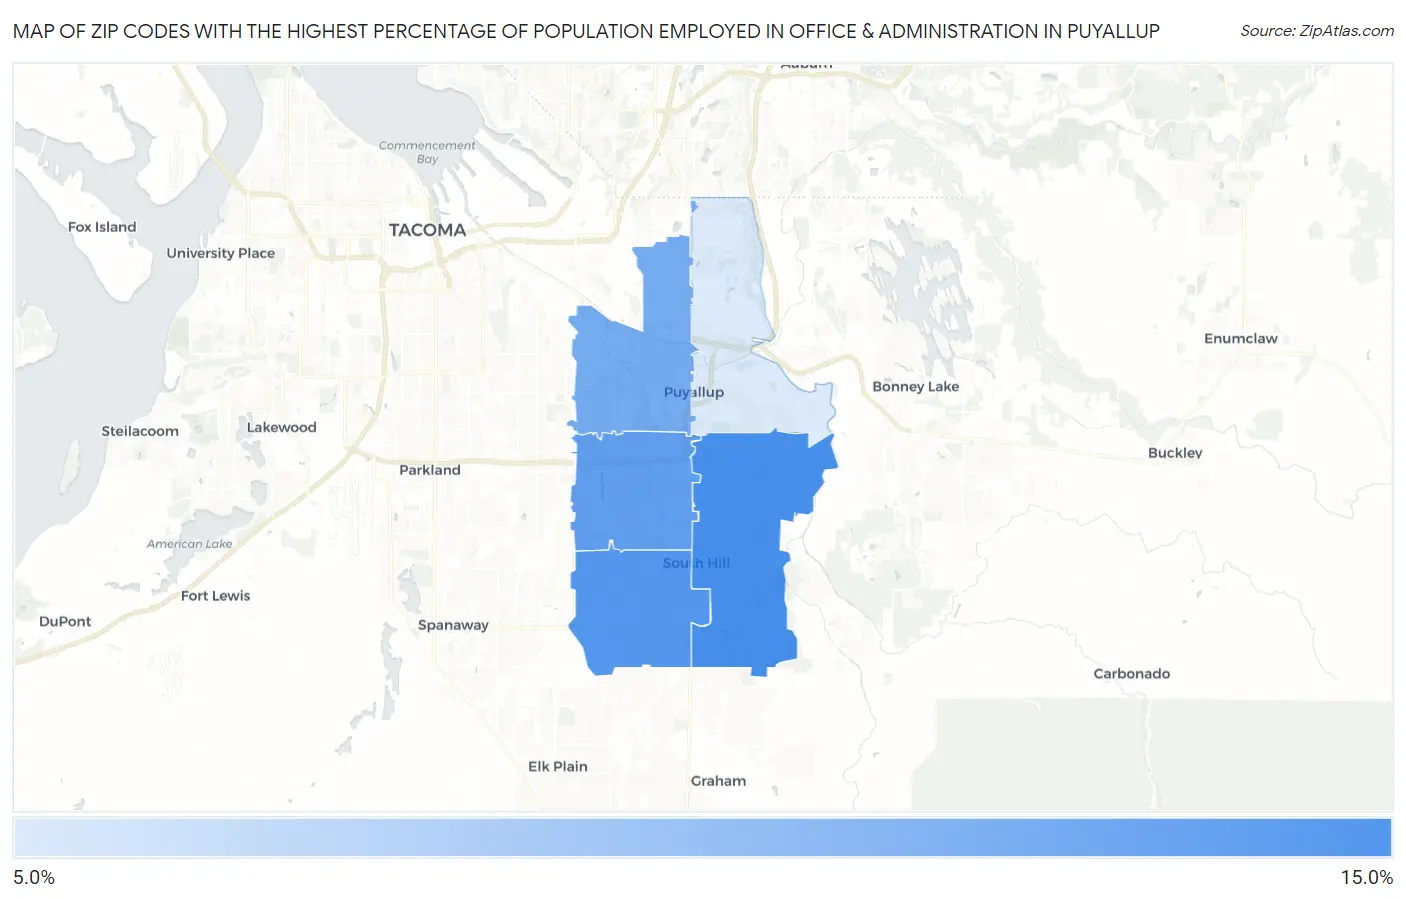
Zip Codes with the Highest Percentage of Population Employed in Office & Administration in Puyallup, WA
| Zip Code | % Employed | vs State | vs National | |
| 1. | 98374 | 14.3% | 9.8%(+4.46)#72 | 10.9%(+3.39)#5,638 |
| 2. | 98375 | 13.8% | 9.8%(+3.96)#84 | 10.9%(+2.90)#6,446 |
| 3. | 98373 | 13.4% | 9.8%(+3.58)#94 | 10.9%(+2.52)#7,193 |
| 4. | 98371 | 12.7% | 9.8%(+2.90)#119 | 10.9%(+1.84)#8,801 |
| 5. | 98372 | 9.3% | 9.8%(-0.512)#304 | 10.9%(-1.57)#19,422 |
1
Common Questions
What are the Top 3 Zip Codes with the Highest Percentage of Population Employed in Office & Administration in Puyallup, WA?
Top 3 Zip Codes with the Highest Percentage of Population Employed in Office & Administration in Puyallup, WA are:
What zip code has the Highest Percentage of Population Employed in Office & Administration in Puyallup, WA?
98374 has the Highest Percentage of Population Employed in Office & Administration in Puyallup, WA with 14.3%.
What is the Percentage of Population Employed in Office & Administration in Puyallup, WA?
Percentage of Population Employed in Office & Administration in Puyallup is 11.7%.
What is the Percentage of Population Employed in Office & Administration in Washington?
Percentage of Population Employed in Office & Administration in Washington is 9.8%.
What is the Percentage of Population Employed in Office & Administration in the United States?
Percentage of Population Employed in Office & Administration in the United States is 10.9%.