Zip Codes with the Highest Percentage of Population Employed in Farming, Fishing & Forestry in Puyallup, WA
RELATED REPORTS & OPTIONS
Farming, Fishing & Forestry
Puyallup
Compare Zip Codes
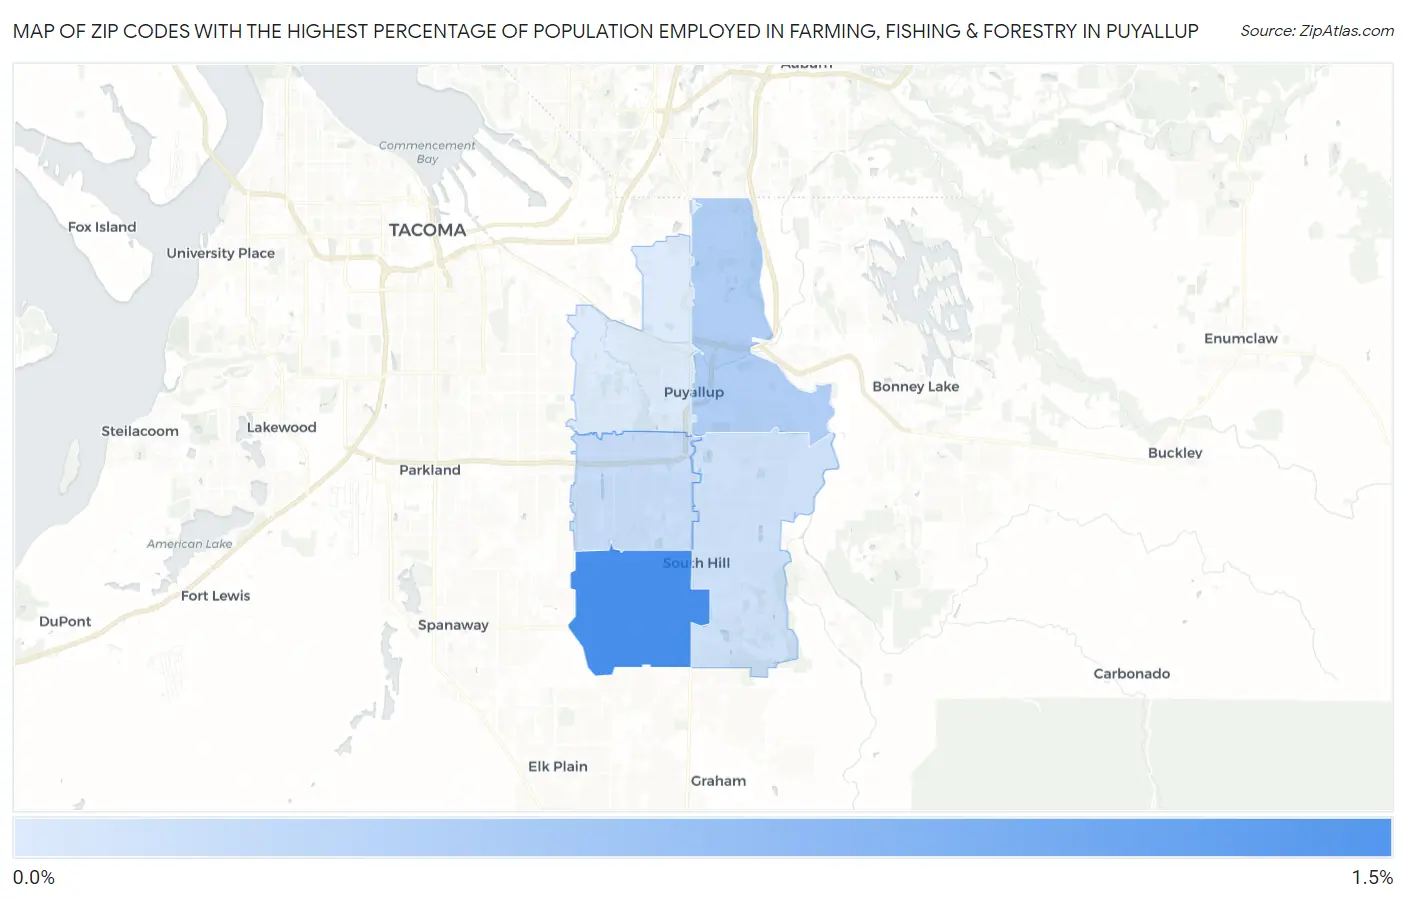
Map of Zip Codes with the Highest Percentage of Population Employed in Farming, Fishing & Forestry in Puyallup
0.19%
1.2%
Zip Codes with the Highest Percentage of Population Employed in Farming, Fishing & Forestry in Puyallup, WA
| Zip Code | % Employed | vs State | vs National | |
| 1. | 98375 | 1.2% | 1.5%(-0.332)#239 | 0.61%(+0.574)#9,007 |
| 2. | 98372 | 0.49% | 1.5%(-1.02)#307 | 0.61%(-0.114)#12,923 |
| 3. | 98373 | 0.32% | 1.5%(-1.19)#345 | 0.61%(-0.284)#14,582 |
| 4. | 98374 | 0.28% | 1.5%(-1.23)#355 | 0.61%(-0.329)#15,106 |
| 5. | 98371 | 0.19% | 1.5%(-1.32)#386 | 0.61%(-0.414)#16,252 |
1
Common Questions
What are the Top 3 Zip Codes with the Highest Percentage of Population Employed in Farming, Fishing & Forestry in Puyallup, WA?
Top 3 Zip Codes with the Highest Percentage of Population Employed in Farming, Fishing & Forestry in Puyallup, WA are:
What zip code has the Highest Percentage of Population Employed in Farming, Fishing & Forestry in Puyallup, WA?
98375 has the Highest Percentage of Population Employed in Farming, Fishing & Forestry in Puyallup, WA with 1.2%.
What is the Percentage of Population Employed in Farming, Fishing & Forestry in Puyallup, WA?
Percentage of Population Employed in Farming, Fishing & Forestry in Puyallup is 0.58%.
What is the Percentage of Population Employed in Farming, Fishing & Forestry in Washington?
Percentage of Population Employed in Farming, Fishing & Forestry in Washington is 1.5%.
What is the Percentage of Population Employed in Farming, Fishing & Forestry in the United States?
Percentage of Population Employed in Farming, Fishing & Forestry in the United States is 0.61%.