Zip Codes with the Highest Percentage of Population Employed in Accommodation & Food Services in Puyallup, WA
RELATED REPORTS & OPTIONS
Accommodation & Food Services
Puyallup
Compare Zip Codes
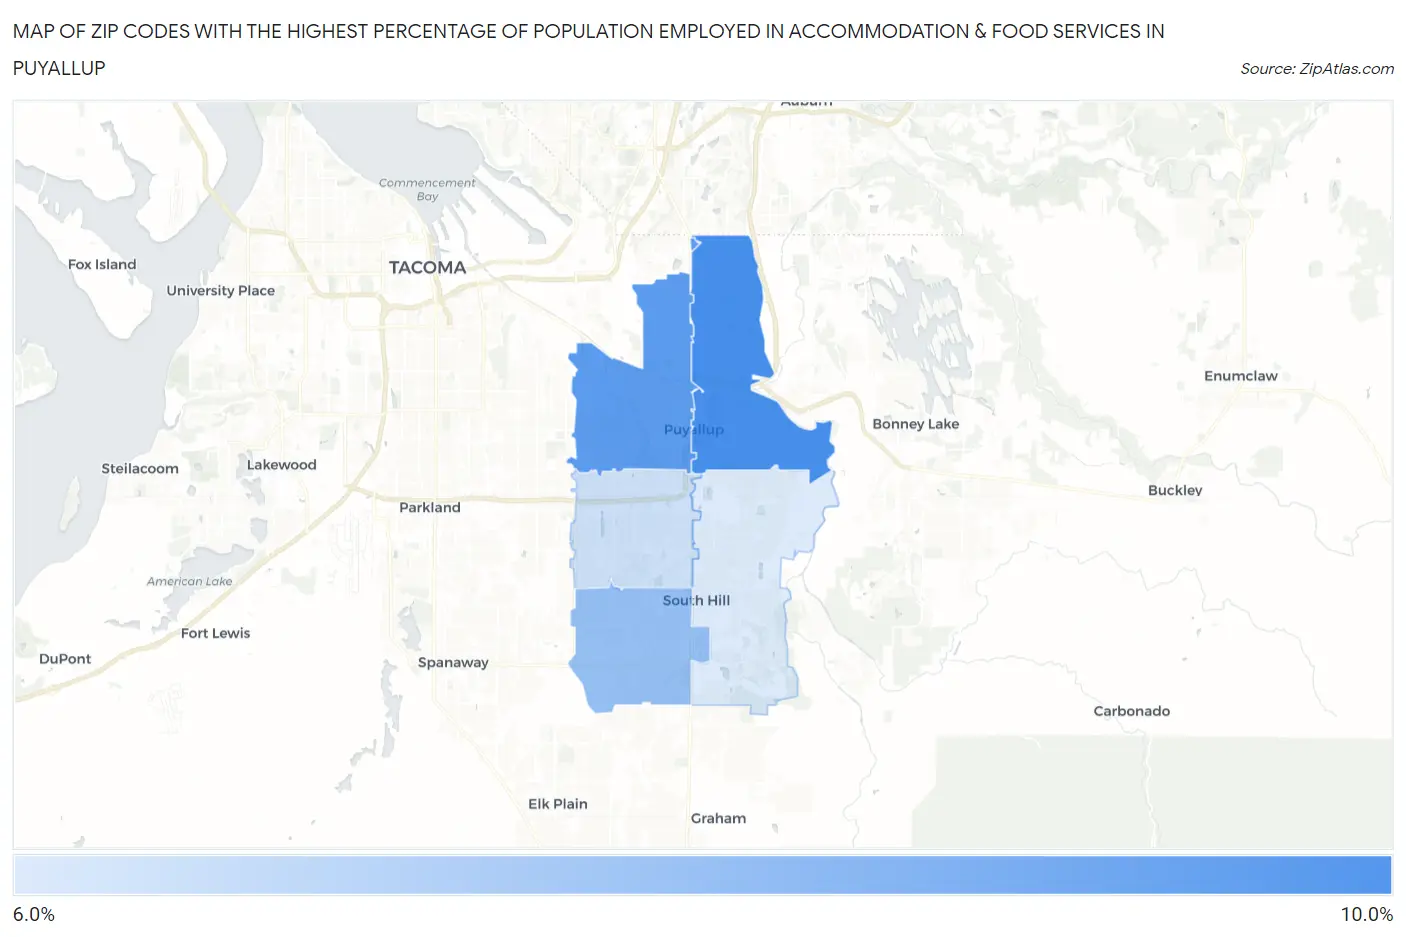
Map of Zip Codes with the Highest Percentage of Population Employed in Accommodation & Food Services in Puyallup
6.3%
8.1%
Zip Codes with the Highest Percentage of Population Employed in Accommodation & Food Services in Puyallup, WA
| Zip Code | % Employed | vs State | vs National | |
| 1. | 98372 | 8.1% | 6.5%(+1.65)#137 | 6.9%(+1.24)#7,599 |
| 2. | 98371 | 7.9% | 6.5%(+1.44)#150 | 6.9%(+1.02)#8,025 |
| 3. | 98375 | 7.2% | 6.5%(+0.702)#186 | 6.9%(+0.284)#9,890 |
| 4. | 98373 | 6.5% | 6.5%(+0.053)#229 | 6.9%(-0.365)#11,795 |
| 5. | 98374 | 6.3% | 6.5%(-0.148)#243 | 6.9%(-0.566)#12,434 |
1
Common Questions
What are the Top 3 Zip Codes with the Highest Percentage of Population Employed in Accommodation & Food Services in Puyallup, WA?
Top 3 Zip Codes with the Highest Percentage of Population Employed in Accommodation & Food Services in Puyallup, WA are:
What zip code has the Highest Percentage of Population Employed in Accommodation & Food Services in Puyallup, WA?
98372 has the Highest Percentage of Population Employed in Accommodation & Food Services in Puyallup, WA with 8.1%.
What is the Percentage of Population Employed in Accommodation & Food Services in Puyallup, WA?
Percentage of Population Employed in Accommodation & Food Services in Puyallup is 7.6%.
What is the Percentage of Population Employed in Accommodation & Food Services in Washington?
Percentage of Population Employed in Accommodation & Food Services in Washington is 6.5%.
What is the Percentage of Population Employed in Accommodation & Food Services in the United States?
Percentage of Population Employed in Accommodation & Food Services in the United States is 6.9%.