Zip Codes with the Highest Percentage of Population Employed in Agriculture, Fishing & Hunting in Puyallup, WA
RELATED REPORTS & OPTIONS
Agriculture, Fishing & Hunting
Puyallup
Compare Zip Codes
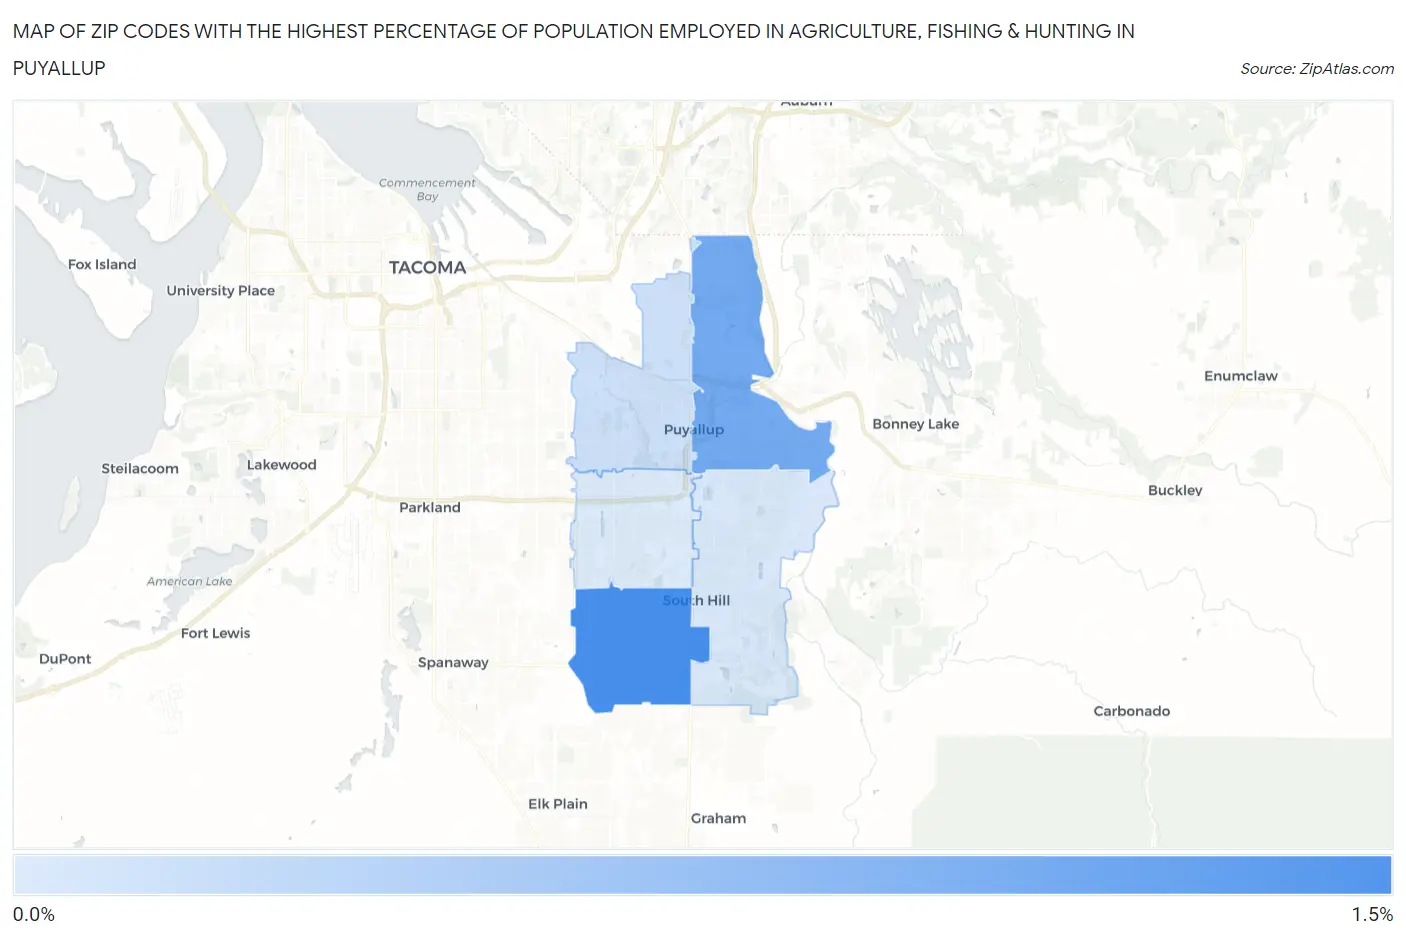
Map of Zip Codes with the Highest Percentage of Population Employed in Agriculture, Fishing & Hunting in Puyallup
0.32%
1.4%
Zip Codes with the Highest Percentage of Population Employed in Agriculture, Fishing & Hunting in Puyallup, WA
| Zip Code | % Employed | vs State | vs National | |
| 1. | 98375 | 1.4% | 2.4%(-1.02)#317 | 1.2%(+0.170)#14,762 |
| 2. | 98372 | 1.1% | 2.4%(-1.33)#343 | 1.2%(-0.143)#15,987 |
| 3. | 98371 | 0.44% | 2.4%(-1.95)#419 | 1.2%(-0.763)#19,836 |
| 4. | 98374 | 0.36% | 2.4%(-2.03)#435 | 1.2%(-0.840)#20,556 |
| 5. | 98373 | 0.32% | 2.4%(-2.07)#445 | 1.2%(-0.878)#20,937 |
1
Common Questions
What are the Top 3 Zip Codes with the Highest Percentage of Population Employed in Agriculture, Fishing & Hunting in Puyallup, WA?
Top 3 Zip Codes with the Highest Percentage of Population Employed in Agriculture, Fishing & Hunting in Puyallup, WA are:
What zip code has the Highest Percentage of Population Employed in Agriculture, Fishing & Hunting in Puyallup, WA?
98375 has the Highest Percentage of Population Employed in Agriculture, Fishing & Hunting in Puyallup, WA with 1.4%.
What is the Percentage of Population Employed in Agriculture, Fishing & Hunting in Puyallup, WA?
Percentage of Population Employed in Agriculture, Fishing & Hunting in Puyallup is 0.71%.
What is the Percentage of Population Employed in Agriculture, Fishing & Hunting in Washington?
Percentage of Population Employed in Agriculture, Fishing & Hunting in Washington is 2.4%.
What is the Percentage of Population Employed in Agriculture, Fishing & Hunting in the United States?
Percentage of Population Employed in Agriculture, Fishing & Hunting in the United States is 1.2%.