Zip Codes with the Highest Percentage of Population Employed in Transportation & Warehousing in Kennewick, WA
RELATED REPORTS & OPTIONS
Transportation & Warehousing
Kennewick
Compare Zip Codes
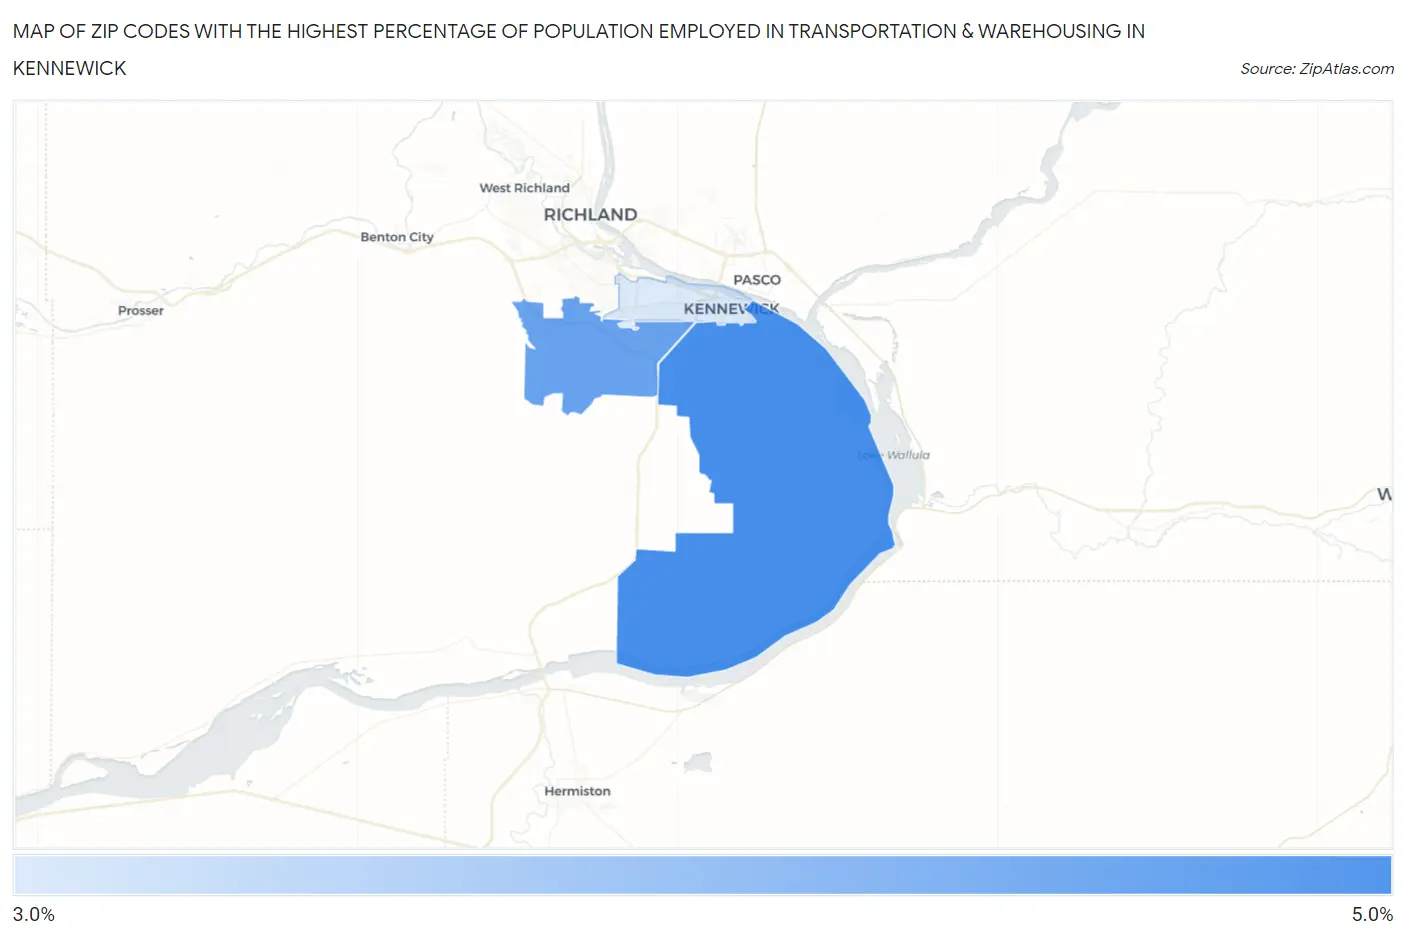
Map of Zip Codes with the Highest Percentage of Population Employed in Transportation & Warehousing in Kennewick
3.7%
4.9%
Zip Codes with the Highest Percentage of Population Employed in Transportation & Warehousing in Kennewick, WA
| Zip Code | % Employed | vs State | vs National | |
| 1. | 99337 | 4.9% | 4.9%(-0.016)#220 | 4.9%(-0.049)#12,286 |
| 2. | 99338 | 4.6% | 4.9%(-0.276)#235 | 4.9%(-0.309)#13,261 |
| 3. | 99336 | 3.7% | 4.9%(-1.24)#303 | 4.9%(-1.27)#17,313 |
1
Common Questions
What are the Top Zip Codes with the Highest Percentage of Population Employed in Transportation & Warehousing in Kennewick, WA?
Top Zip Codes with the Highest Percentage of Population Employed in Transportation & Warehousing in Kennewick, WA are:
What zip code has the Highest Percentage of Population Employed in Transportation & Warehousing in Kennewick, WA?
99337 has the Highest Percentage of Population Employed in Transportation & Warehousing in Kennewick, WA with 4.9%.
What is the Percentage of Population Employed in Transportation & Warehousing in Kennewick, WA?
Percentage of Population Employed in Transportation & Warehousing in Kennewick is 4.4%.
What is the Percentage of Population Employed in Transportation & Warehousing in Washington?
Percentage of Population Employed in Transportation & Warehousing in Washington is 4.9%.
What is the Percentage of Population Employed in Transportation & Warehousing in the United States?
Percentage of Population Employed in Transportation & Warehousing in the United States is 4.9%.