Zip Codes with the Highest Percentage of Population Employed in Arts, Entertainment & Recreation in Canyon, TX
RELATED REPORTS & OPTIONS
Arts, Entertainment & Recreation
Canyon
Compare Zip Codes
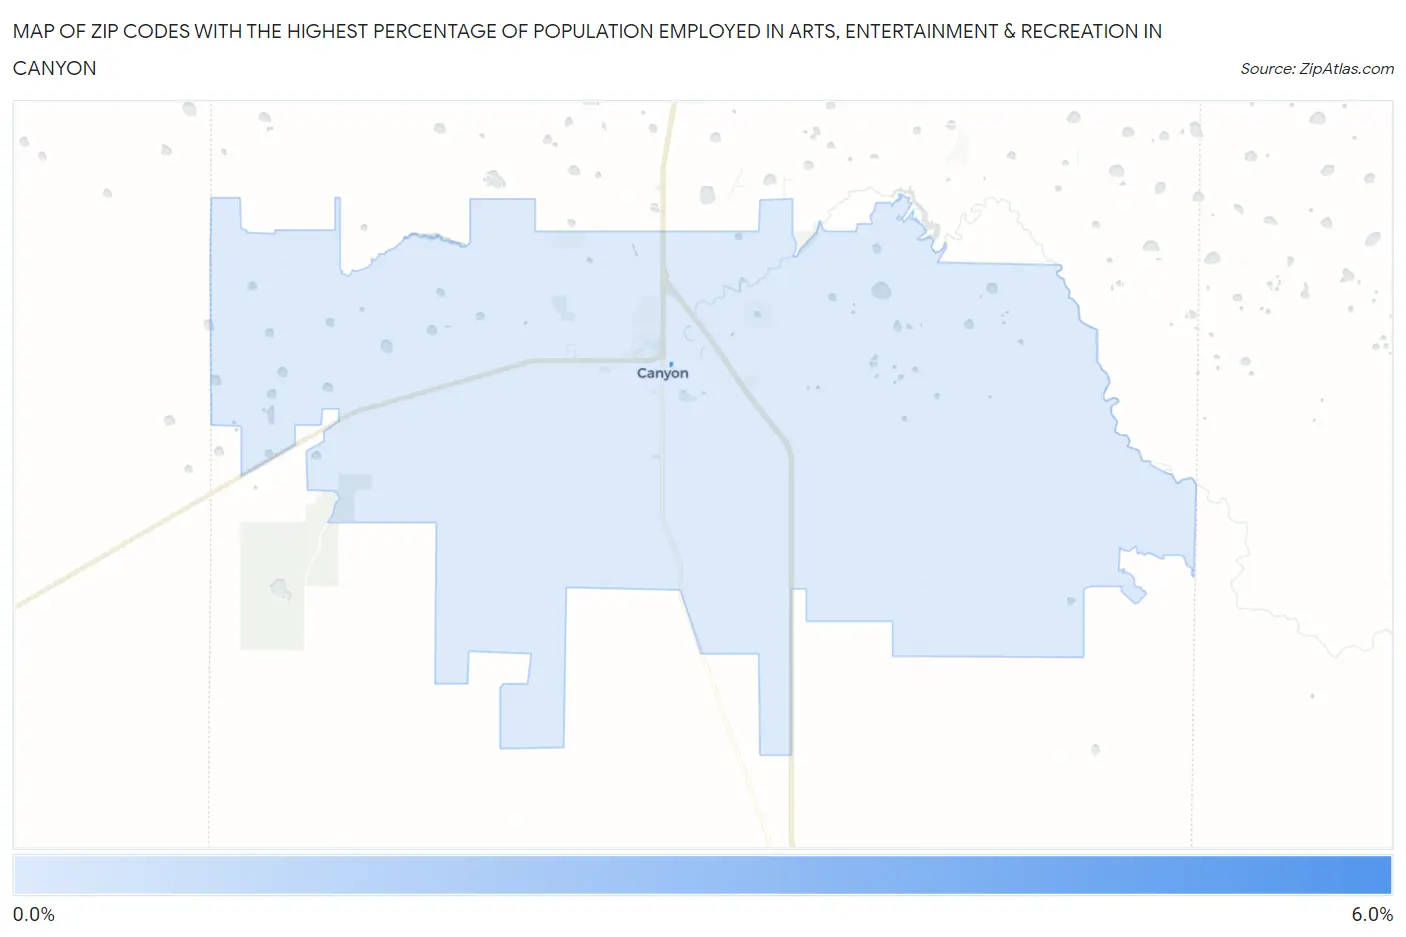
Map of Zip Codes with the Highest Percentage of Population Employed in Arts, Entertainment & Recreation in Canyon
0.98%
5.9%
Zip Codes with the Highest Percentage of Population Employed in Arts, Entertainment & Recreation in Canyon, TX
| Zip Code | % Employed | vs State | vs National | |
| 1. | 79016 | 5.9% | 1.5%(+4.48)#32 | 2.1%(+3.86)#1,728 |
| 2. | 79015 | 0.98% | 1.5%(-0.480)#839 | 2.1%(-1.10)#17,101 |
1
Common Questions
What are the Top Zip Codes with the Highest Percentage of Population Employed in Arts, Entertainment & Recreation in Canyon, TX?
Top Zip Codes with the Highest Percentage of Population Employed in Arts, Entertainment & Recreation in Canyon, TX are:
What zip code has the Highest Percentage of Population Employed in Arts, Entertainment & Recreation in Canyon, TX?
79016 has the Highest Percentage of Population Employed in Arts, Entertainment & Recreation in Canyon, TX with 5.9%.
What is the Percentage of Population Employed in Arts, Entertainment & Recreation in Canyon, TX?
Percentage of Population Employed in Arts, Entertainment & Recreation in Canyon is 0.75%.
What is the Percentage of Population Employed in Arts, Entertainment & Recreation in Texas?
Percentage of Population Employed in Arts, Entertainment & Recreation in Texas is 1.5%.
What is the Percentage of Population Employed in Arts, Entertainment & Recreation in the United States?
Percentage of Population Employed in Arts, Entertainment & Recreation in the United States is 2.1%.