Zip Codes with the Highest Percentage of Population with a Degree in Visual and Performing Arts in Cleveland, TN
RELATED REPORTS & OPTIONS
Visual and Performing Arts
Cleveland
Compare Zip Codes
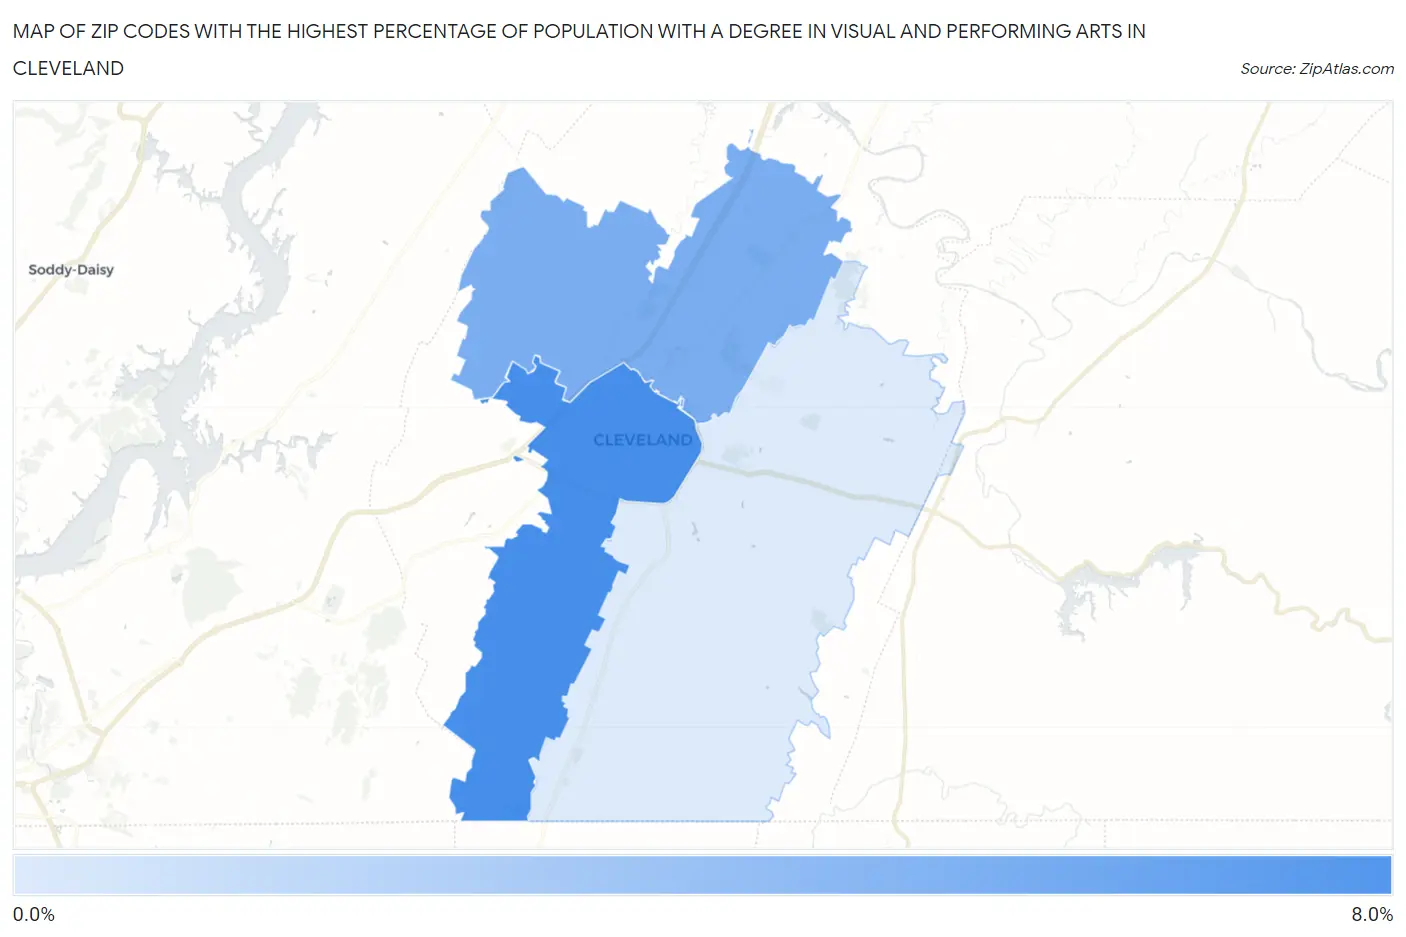
Map of Zip Codes with the Highest Percentage of Population with a Degree in Visual and Performing Arts in Cleveland
0.64%
7.2%
Zip Codes with the Highest Percentage of Population with a Degree in Visual and Performing Arts in Cleveland, TN
| Zip Code | % Graduates | vs State | vs National | |
| 1. | 37311 | 7.2% | 4.1%(+3.10)#68 | 4.3%(+2.91)#3,494 |
| 2. | 37312 | 5.0% | 4.1%(+0.891)#141 | 4.3%(+0.703)#6,751 |
| 3. | 37323 | 0.64% | 4.1%(-3.43)#385 | 4.3%(-3.61)#20,493 |
1
Common Questions
What are the Top Zip Codes with the Highest Percentage of Population with a Degree in Visual and Performing Arts in Cleveland, TN?
Top Zip Codes with the Highest Percentage of Population with a Degree in Visual and Performing Arts in Cleveland, TN are:
What zip code has the Highest Percentage of Population with a Degree in Visual and Performing Arts in Cleveland, TN?
37311 has the Highest Percentage of Population with a Degree in Visual and Performing Arts in Cleveland, TN with 7.2%.
What is the Percentage of Population with a Degree in Visual and Performing Arts in Cleveland, TN?
Percentage of Population with a Degree in Visual and Performing Arts in Cleveland is 4.9%.
What is the Percentage of Population with a Degree in Visual and Performing Arts in Tennessee?
Percentage of Population with a Degree in Visual and Performing Arts in Tennessee is 4.1%.
What is the Percentage of Population with a Degree in Visual and Performing Arts in the United States?
Percentage of Population with a Degree in Visual and Performing Arts in the United States is 4.3%.