Zip Codes with the Highest Percentage of Population Taking Taxi / Cab to Work in Cleveland, TN
RELATED REPORTS & OPTIONS
Taxi / Cab
Cleveland
Compare Zip Codes
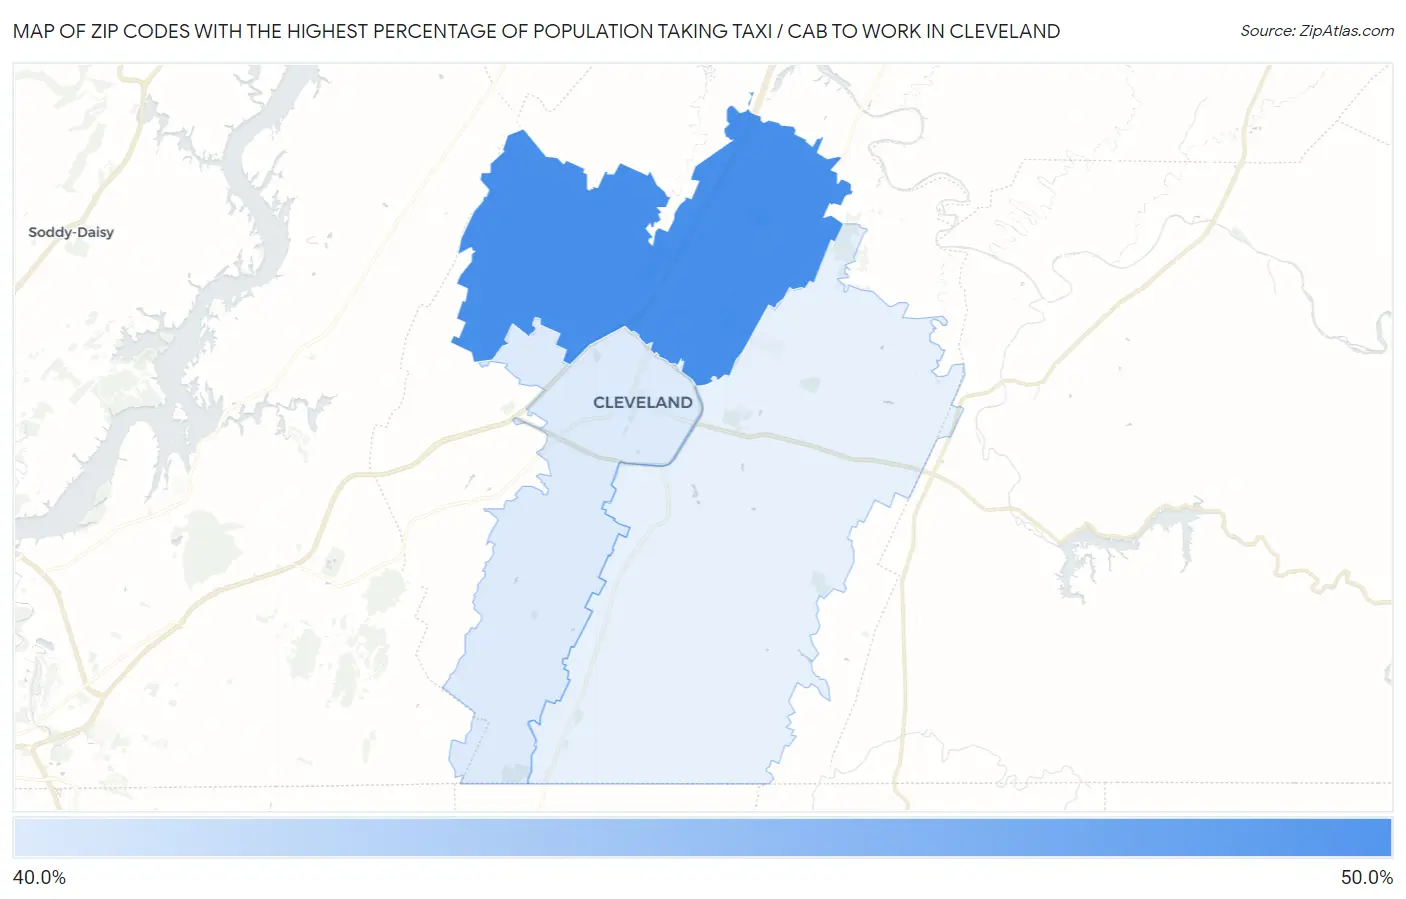
Map of Zip Codes with the Highest Percentage of Population Taking Taxi / Cab to Work in Cleveland
46.3%
47.4%
Zip Codes with the Highest Percentage of Population Taking Taxi / Cab to Work in Cleveland, TN
| Zip Code | % Take Taxi / Cab | vs State | vs National | |
| 1. | 37312 | 47.4% | 37.3%(+10.1)#63 | 38.2%(+9.20)#3,822 |
| 2. | 37311 | 46.3% | 37.3%(+9.00)#71 | 38.2%(+8.10)#4,202 |
1
Common Questions
What are the Top Zip Codes with the Highest Percentage of Population Taking Taxi / Cab to Work in Cleveland, TN?
Top Zip Codes with the Highest Percentage of Population Taking Taxi / Cab to Work in Cleveland, TN are:
What zip code has the Highest Percentage of Population Taking Taxi / Cab to Work in Cleveland, TN?
37312 has the Highest Percentage of Population Taking Taxi / Cab to Work in Cleveland, TN with 47.4%.
What is the Percentage of Population Taking Taxi / Cab to Work in Cleveland, TN?
Percentage of Population Taking Taxi / Cab to Work in Cleveland is 46.9%.
What is the Percentage of Population Taking Taxi / Cab to Work in Tennessee?
Percentage of Population Taking Taxi / Cab to Work in Tennessee is 37.3%.
What is the Percentage of Population Taking Taxi / Cab to Work in the United States?
Percentage of Population Taking Taxi / Cab to Work in the United States is 38.2%.