Zip Codes with the Highest Percentage of Population with a Degree in Liberal Arts and History in Clarksville, TN
RELATED REPORTS & OPTIONS
Liberal Arts and History
Clarksville
Compare Zip Codes
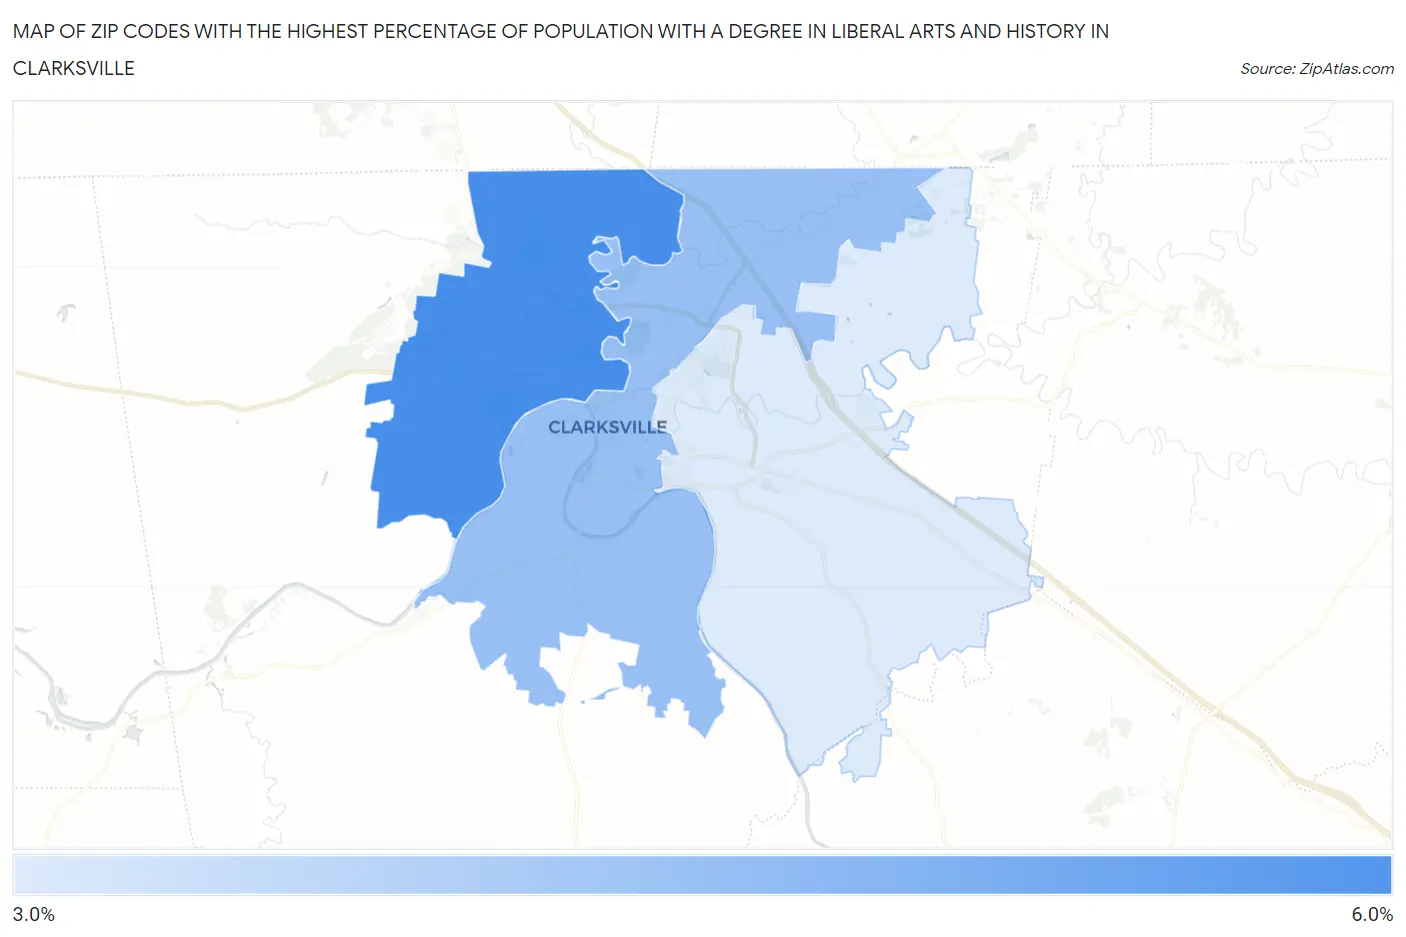
Map of Zip Codes with the Highest Percentage of Population with a Degree in Liberal Arts and History in Clarksville
3.8%
5.5%
Zip Codes with the Highest Percentage of Population with a Degree in Liberal Arts and History in Clarksville, TN
| Zip Code | % Graduates | vs State | vs National | |
| 1. | 37042 | 5.5% | 4.9%(+0.661)#195 | 4.9%(+0.667)#9,757 |
| 2. | 37040 | 4.6% | 4.9%(-0.276)#253 | 4.9%(-0.269)#12,636 |
| 3. | 37043 | 3.8% | 4.9%(-1.05)#312 | 4.9%(-1.05)#15,426 |
1
Common Questions
What are the Top Zip Codes with the Highest Percentage of Population with a Degree in Liberal Arts and History in Clarksville, TN?
Top Zip Codes with the Highest Percentage of Population with a Degree in Liberal Arts and History in Clarksville, TN are:
What zip code has the Highest Percentage of Population with a Degree in Liberal Arts and History in Clarksville, TN?
37042 has the Highest Percentage of Population with a Degree in Liberal Arts and History in Clarksville, TN with 5.5%.
What is the Percentage of Population with a Degree in Liberal Arts and History in Clarksville, TN?
Percentage of Population with a Degree in Liberal Arts and History in Clarksville is 5.0%.
What is the Percentage of Population with a Degree in Liberal Arts and History in Tennessee?
Percentage of Population with a Degree in Liberal Arts and History in Tennessee is 4.9%.
What is the Percentage of Population with a Degree in Liberal Arts and History in the United States?
Percentage of Population with a Degree in Liberal Arts and History in the United States is 4.9%.